
Centrality-Based Attack Strategies and Network Fragmentation in the London Underground: A Graph-Theoretic Resilience Assessment
Published:
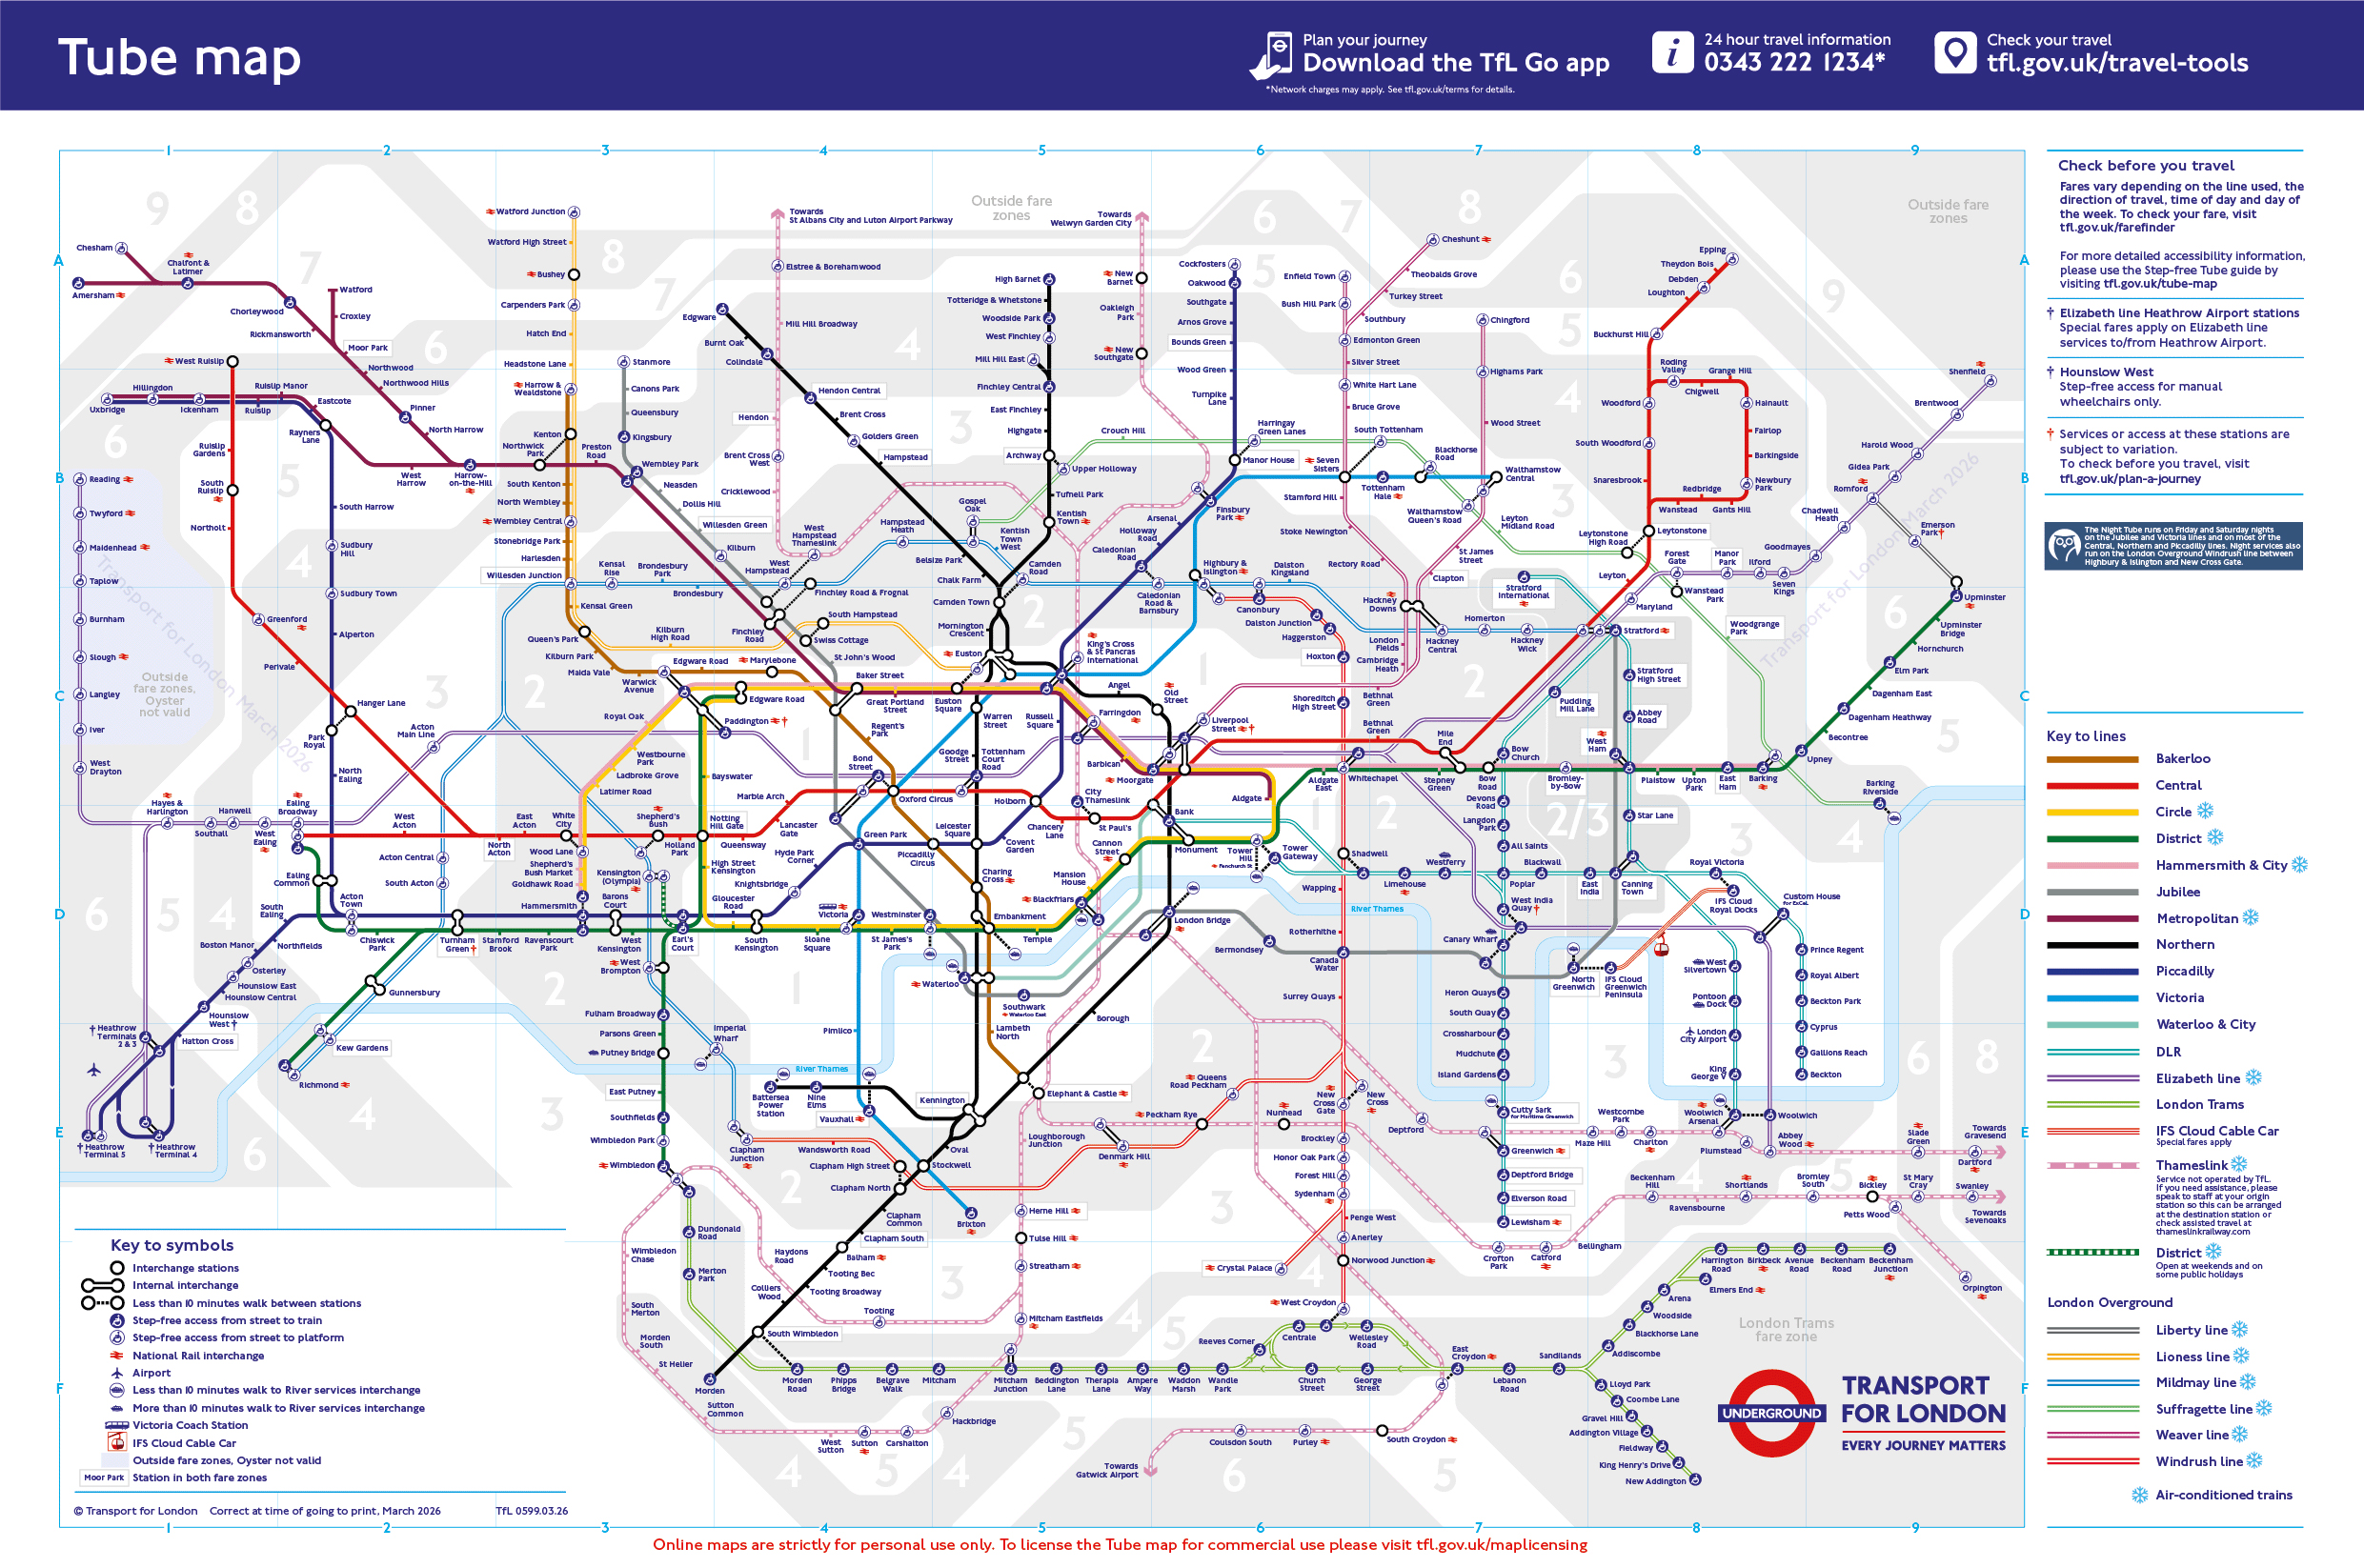
This study applies complex network analysis to assess the resilience of the London Underground under targeted station removal. Three centrality measures — degree, betweenness, and closeness — are computed on both the topological and flow-weighted network. Sequential node removal reveals that betweenness-based attack causes the most rapid fragmentation, reducing the largest connected component to 0.42 after just 10 removals, while degree-based removal performs no better than random failure. The weighted network analysis shifts critical stations from Stratford to Bank and Monument and Green Park. An alternative routing analysis further identifies Embankment as the optimal substitute station when Waterloo is closed, adding approximately 10 minutes to the journey.
1. Topological Network
Degree centrality, betweenness centrality and closeness centrality, which respectively capture local connectivity, intermediary control, and global reachability (Freeman, 1978), were selected in this work to identify the most critical stations in the London Underground.
1.1 Centrality Measures
Degree centrality, first introduced by Nieminen (1974) and later formalised by Freeman (1978), measures a node’s importance by counting its direct adjacencies:
\[C_D(p_k) = \sum_{i=1}^{n} u(p_i, p_k) \quad (i \neq k)\]where $u(p_i, p_k) = 1$ if $p_i$ and $p_k$ are connected, and 0 otherwise. Degree centrality reflects a station’s local accessibility (Tepsan et al., 2025), identifying major interchange hubs whose removal would immediately sever multiple direct connections (Guo & Lu, 2016).
Note: Freeman (1978) also proposed a normalised form $C_D(v) = \frac{\deg(v)}{n-1}$, which scales scores to $[0,1]$ to allow comparison across networks of different sizes. The unnormalised form is used here as all stations belong to the same network, rendering normalisation unnecessary.
Betweenness centrality, formalised by Freeman (1978), measures a node’s importance by quantifying how frequently it lies on the shortest path between other node pairs:
\[C_B(p_k) = \sum_{i < j} \frac{\sigma_{ij}(p_k)}{\sigma_{ij}} \quad (i \neq j \neq k)\]where $\sigma_{ij}$ is the total number of shortest paths between nodes $i$ and $j$, and $\sigma_{ij}(p_k)$ is the number of those paths passing through $p_k$. It identifies critical “bridge” stations; high-betweenness stations are vulnerable points where disruption forces passengers onto longer routes or disconnects the network entirely (Guo & Lu, 2016).
Note: The summation uses $i < j$ as the London Underground is modelled as an undirected graph, ensuring each node pair is counted only once. For directed graphs, the condition would be replaced by $i \neq j$, as paths from $i$ to $j$ and from $j$ to $i$ are distinct. A normalised form dividing by $(n-1)(n-2)/2$ is also available for cross-network comparison (Freeman, 1978); the unnormalised form is used here.
Closeness centrality, introduced by Sabidussi (1966) and later systematised by Freeman (1978), measures a node’s importance by quantifying how efficiently it can reach all other nodes in the network:
\[C_C(p_k) = \frac{n-1}{\sum_{i=1}^{n} d(p_i, p_k)} \quad (i \neq k)\]where $d(p_i, p_k)$ is the shortest path length between nodes $i$ and $k$, and $n$ is the total number of nodes. Removal of high-closeness stations significantly increases average travel time and distances, impacting overall underground accessibility.
Note: Closeness centrality is inherently normalised by $(n-1)$ in its formulation, placing scores in the range $[0,1]$.
Table 1 summarises the top-ranked stations under each centrality measure.
Table 1. Top-10 stations ranked by each centrality measure on the topological underground network.
| Rank | Degree Centrality | Rank | Betweenness Centrality | Rank | Closeness Centrality |
|---|---|---|---|---|---|
| 1 | Stratford | 1 | Stratford | 1 | Green Park |
| 2 | Bank and Monument | 2 | Bank and Monument | 2 | Bank and Monument |
| 3ᵃ | King’s Cross St. Pancras | 3 | Liverpool Street | 3 | King’s Cross St. Pancras |
| 4ᵃ | Baker Street | 4 | King’s Cross St. Pancras | 4 | Westminster |
| 5ᵇ | West Ham | 5 | Waterloo | 5 | Waterloo |
| 6ᵇ | Oxford Circus | 6 | Green Park | 6 | Oxford Circus |
| 7ᵇ | Earl’s Court | 7 | Euston | 7 | Bond Street |
| 8ᵇ | Canning Town | 8 | Westminster | 8 | Farringdon |
| 9ᵇ | Liverpool Street | 9 | Baker Street | 9 | Angel |
| 10ᵇ | Waterloo | 10 | Finchley Road | 10 | Moorgate |
Note: Centrality values computed using NetworkX on the undirected topological graph. Ranks sharing the same superscript indicate stations with identical degree centrality values; ordering among tied stations follows their appearance in the dataset.
1.2 Node Removal and Largest Connected Component
Following the methodology of Albert et al. (2000), the relative largest connected component (LCC) size is employed here and recomputed after each removal:
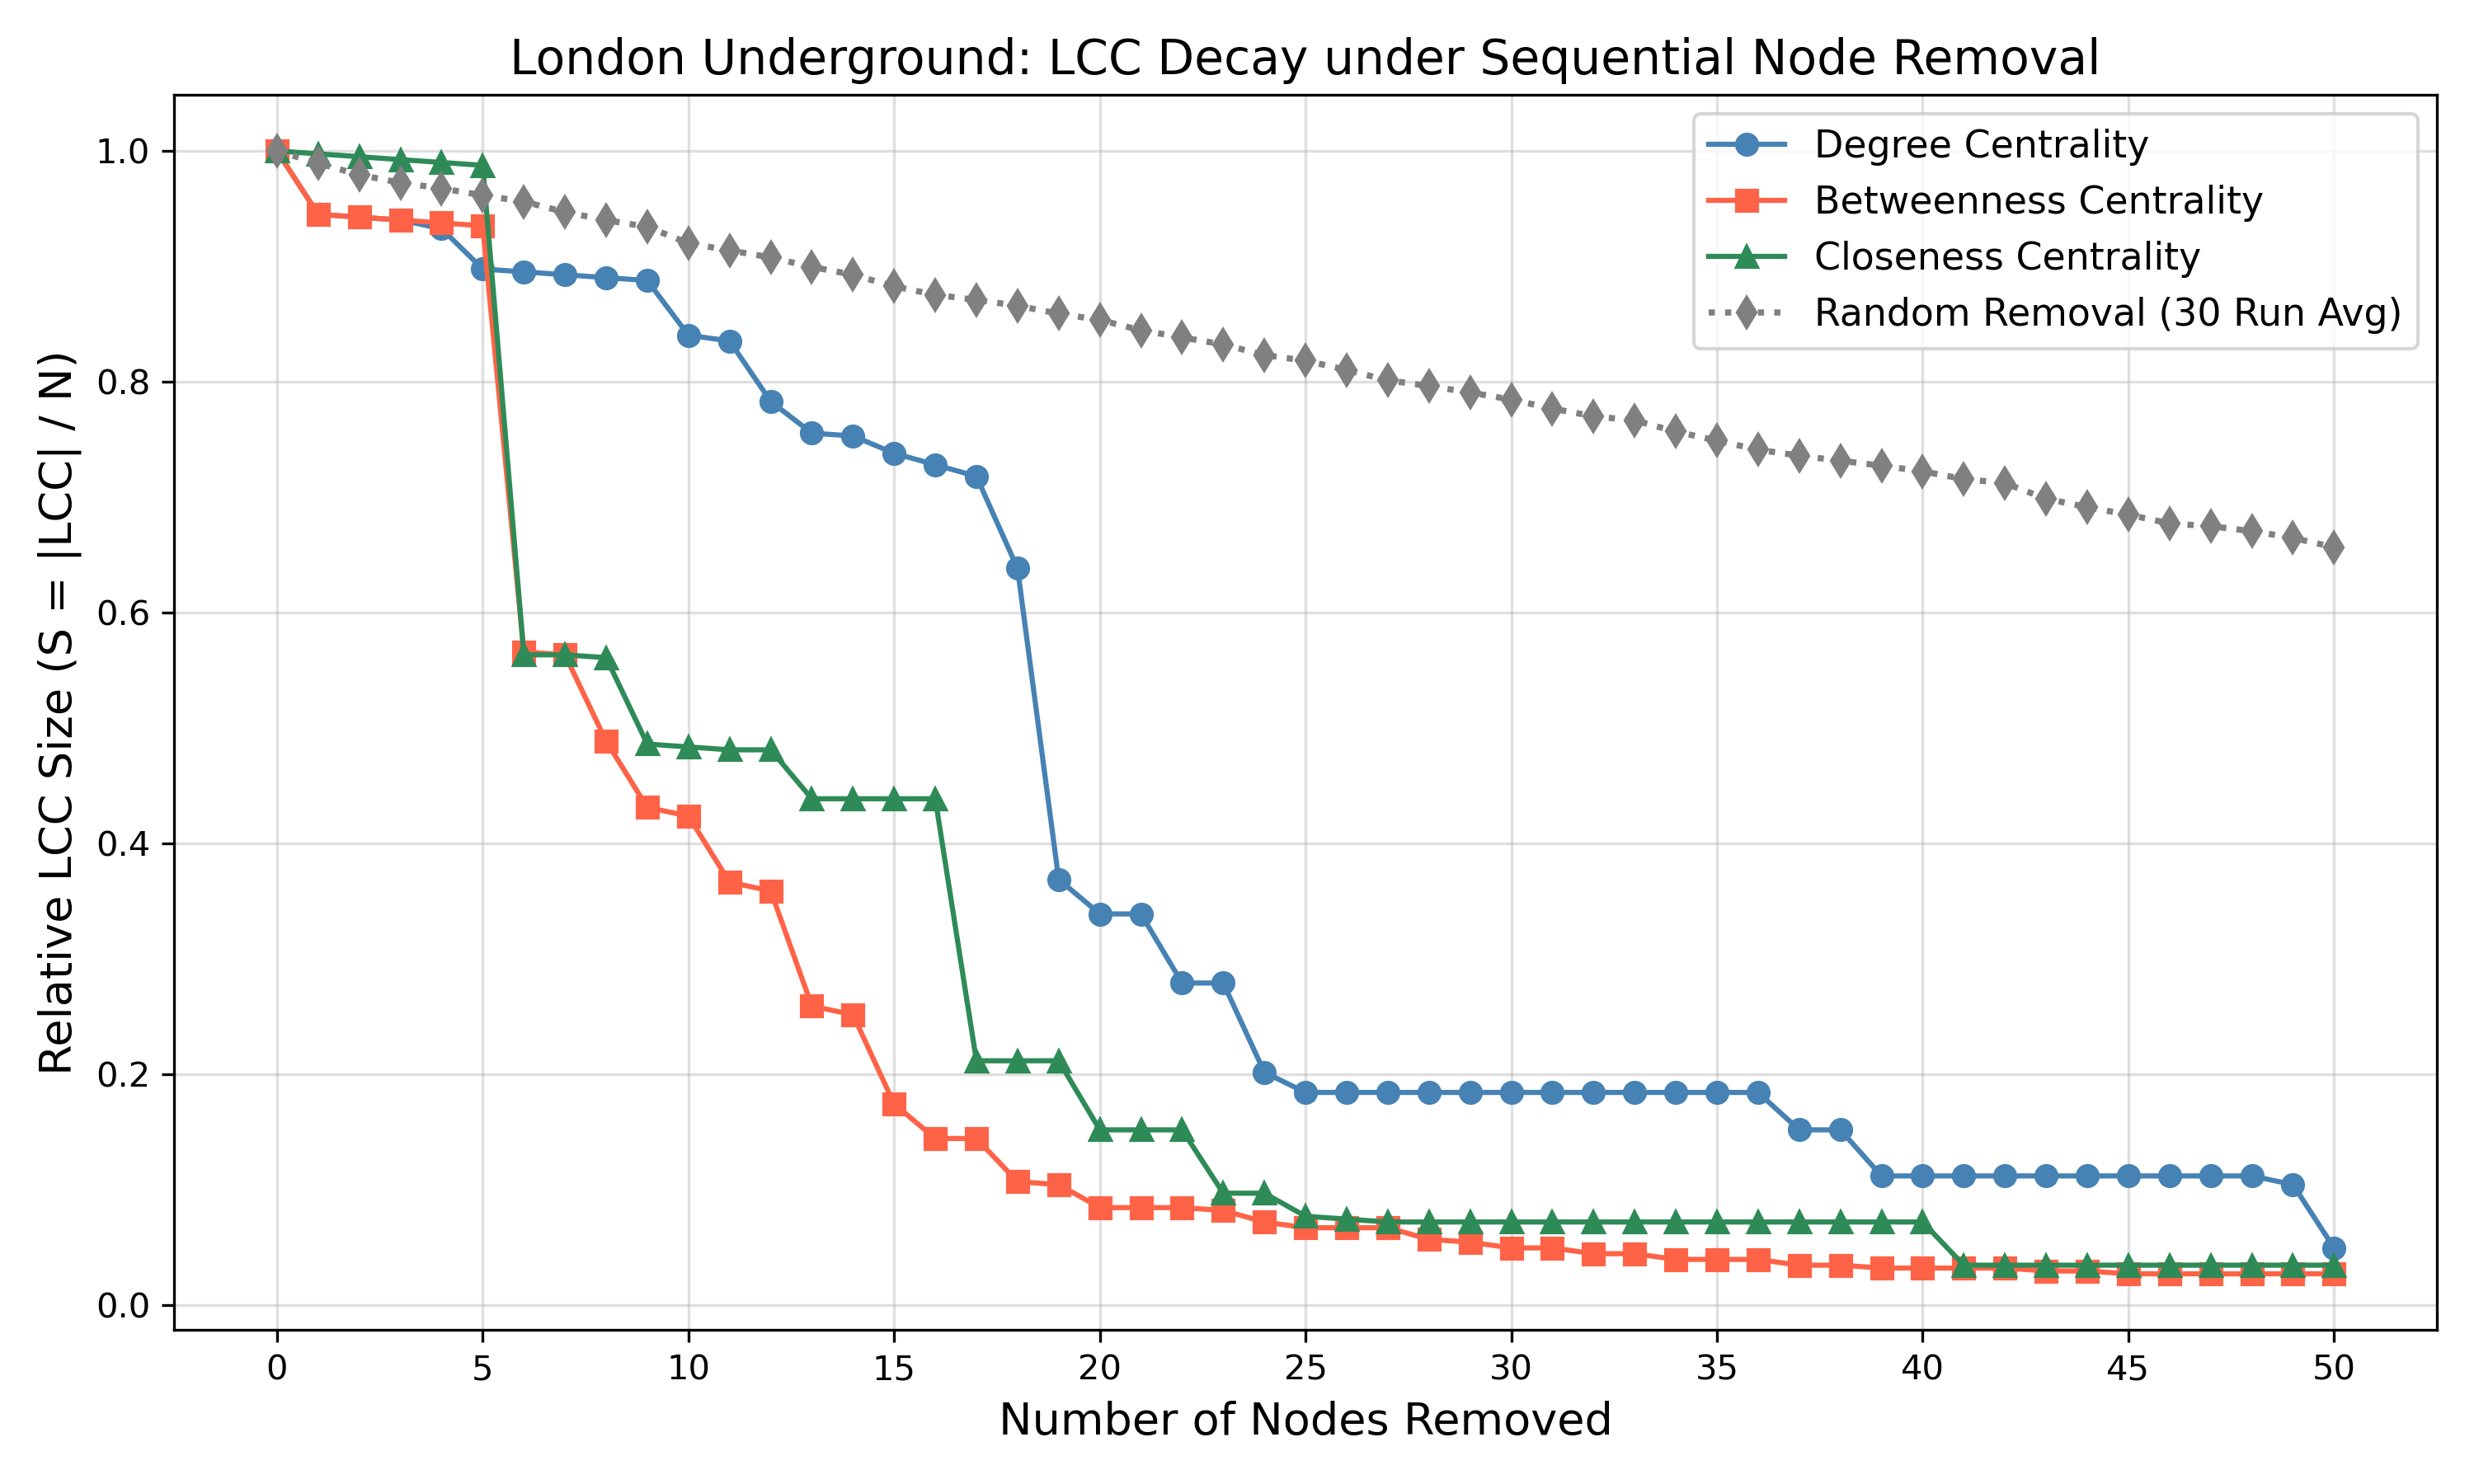
\[S = \frac{|\text{LCC}|}{N}\]where $|\text{LCC}|$ is the number of nodes in the LCC and $N$ is the original total number of nodes. The metric is selected in this work as it remains well-defined under fragmentation and enables comparison across attack strategies, directly reflecting the proportion of the network still accessible to passengers (von Ferber et al., 2012). The results of 50-step sequential removal are shown in Figure 1.
Degree centrality. Degree-based removal produces the slowest LCC decay among the three targeted strategies, closely tracking the random removal baseline throughout the first 10 removals before gradually diverging, confirming degree centrality’s focus on local connectivity. However, a station with many direct connections is not necessarily critical for maintaining global topology here.
Betweenness centrality. Betweenness-based removal causes the most rapid LCC decay. After just 6 removals, the LCC drops sharply from 0.94 to 0.57, and by step 10 it falls to 0.42. Betweenness centrality targets stations that serve as bridges between otherwise disconnected regions, and their removal severs the shortest paths that bind the network together, triggering rapid network fragmentation.
Closeness centrality. Closeness-based removal exhibits intermediate efficiency. For the first 5 removals, its LCC decay is even slower than the random removal baseline, but a sharp collapse at step 6 plunges the LCC from 0.99 to 0.56. This rhythmic, stepwise pattern recurs throughout: the LCC stabilises for three to four removals then drops abruptly, showing global reachability’s inability to efficiently identify London Underground weak points. Consecutive removals yield diminishing impact until a critical bridging station is reached, triggering sudden fragmentation.
The results of the sequential node removal analysis are consistent with the broader network resilience literature. Albert et al. (2000) demonstrated that degree-based attack is devastating to scale-free networks because their power-law degree distribution concentrates connectivity in a few high-degree hubs. The London Underground, however, exhibits a narrow degree distribution concentrated around $k = 2$ (Figure 2), lacking such hubs. Consequently, the most connected stations are only marginally more important than average, and degree centrality performs ineffectively in this context.
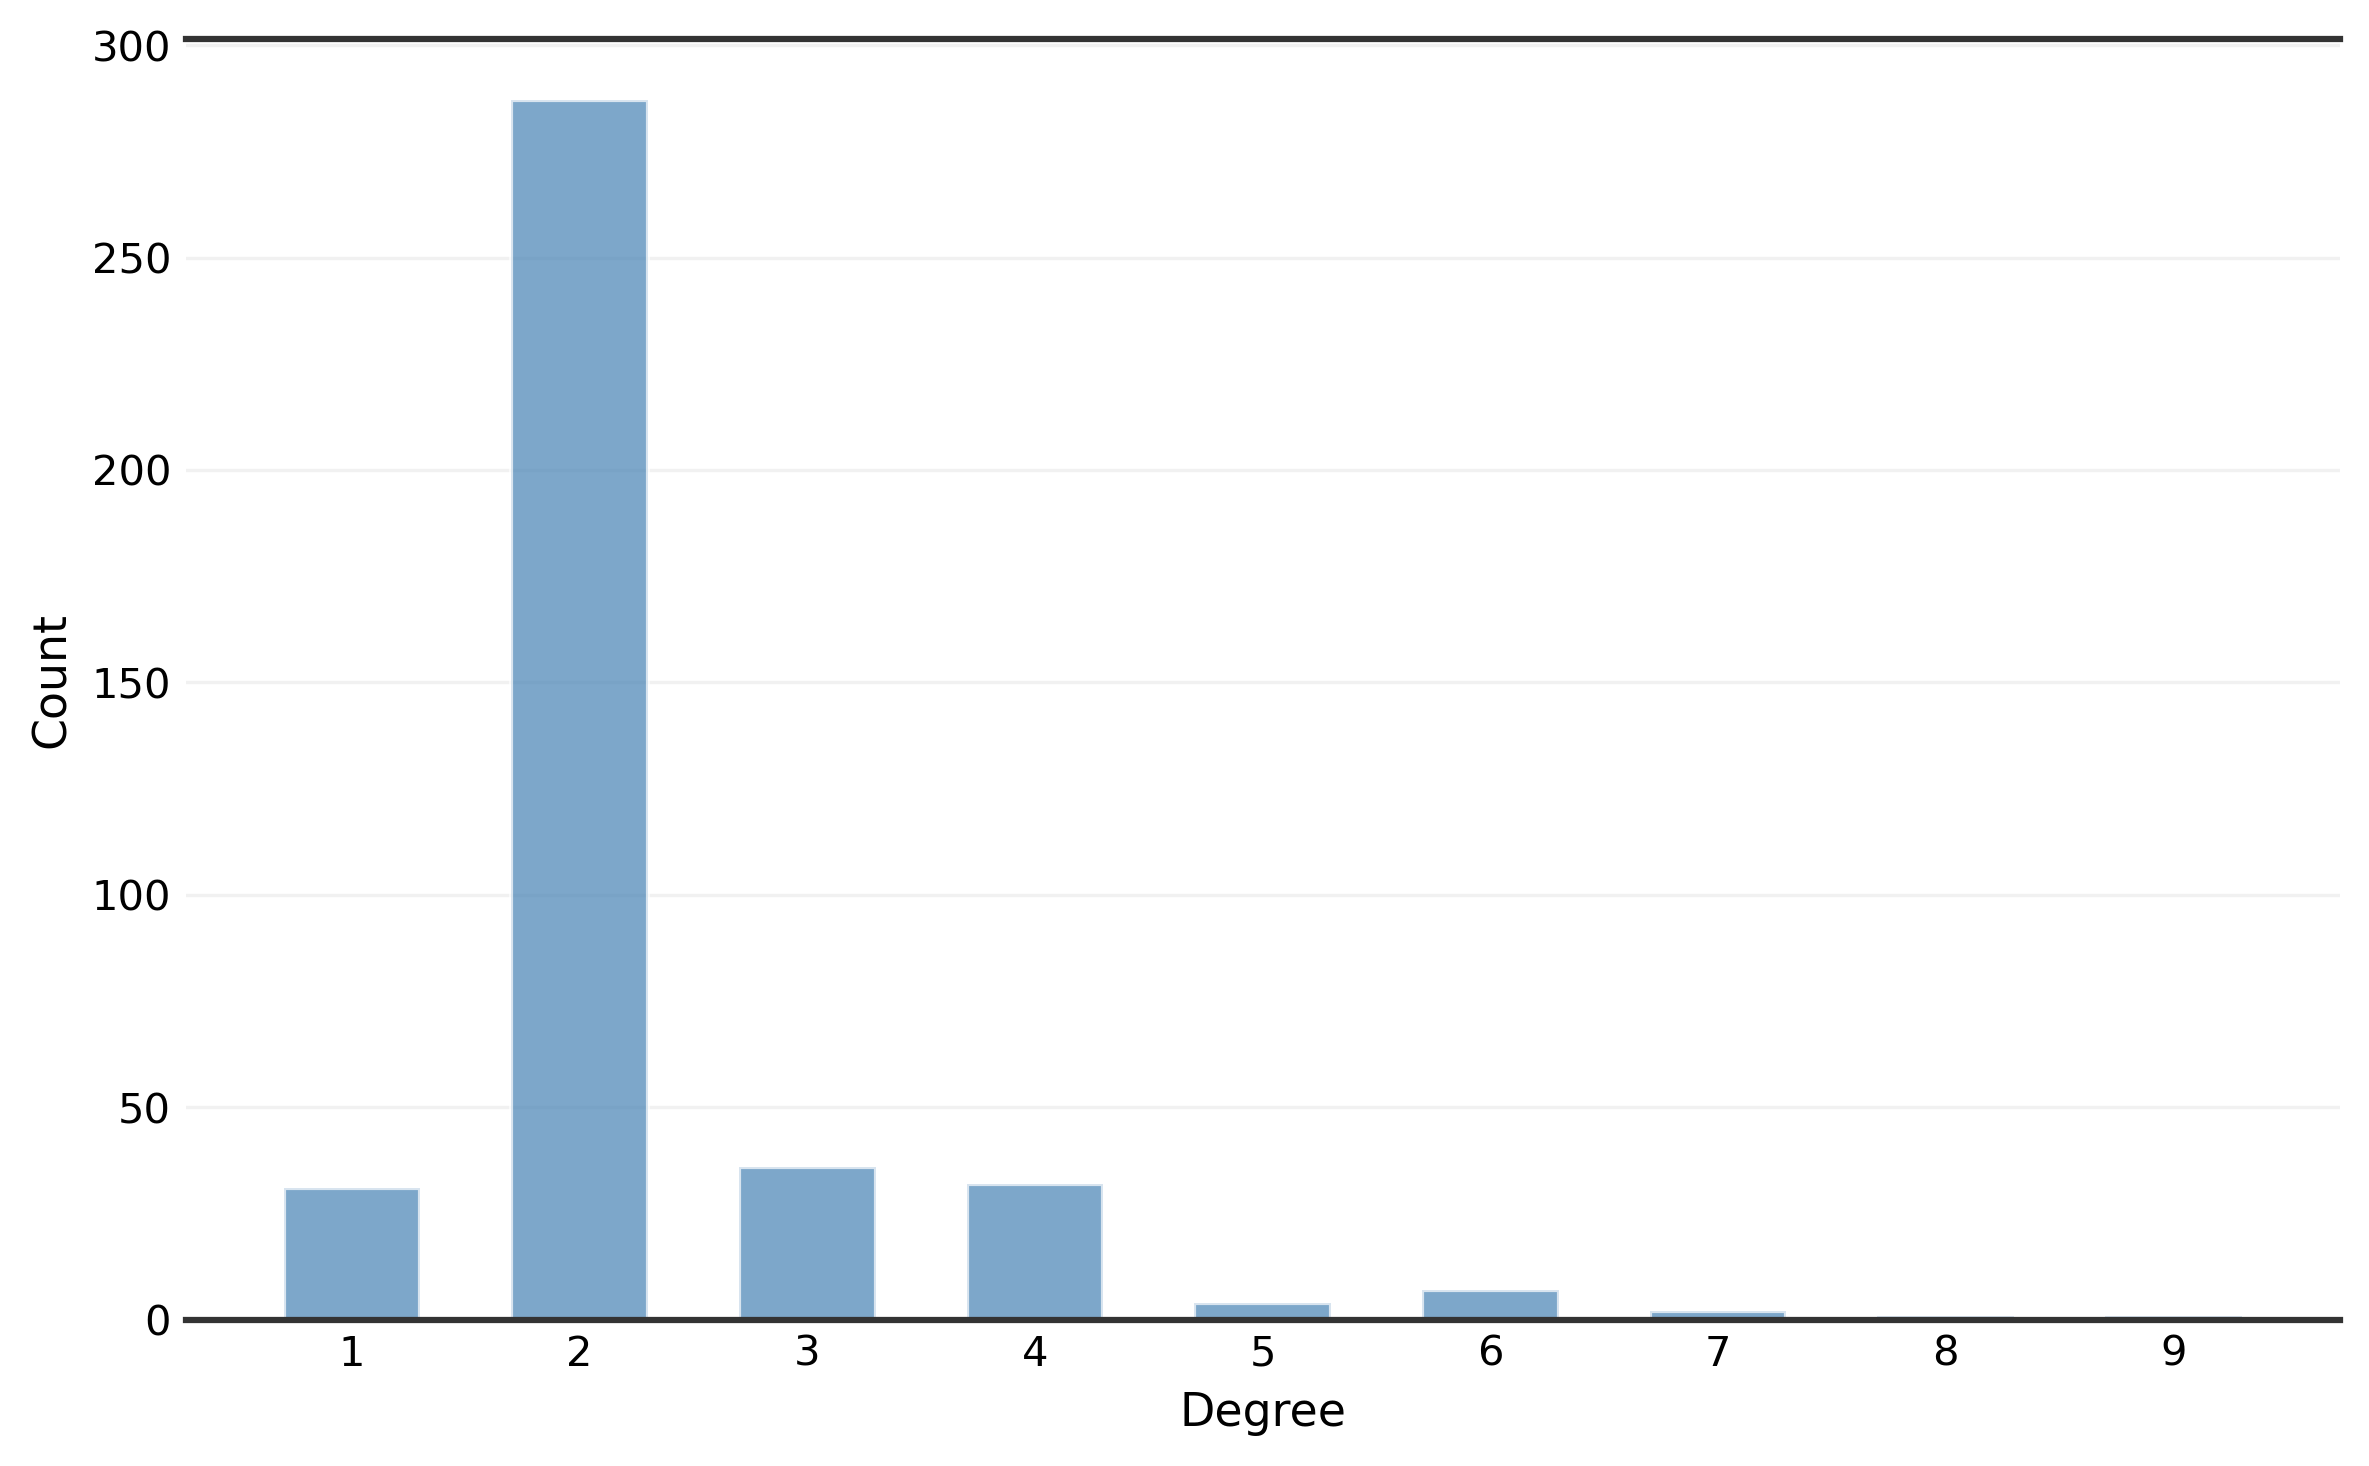
The computed clustering coefficient ($C = 0.03$) and average path length ($L = 13.55$) align with the findings of Chopra et al. (2016), confirming the absence of the redundancy and short-path connectivity in London Underground network that would provide fault tolerance. This topological structure explains why betweenness-based removal is the most effective attack strategy, while closeness-based removal, targeting global accessibility but not necessarily bridging stations, is comparatively less efficient.
Note: The clustering coefficient measures the probability that two stations connected to a common station are also directly connected to each other, capturing local redundancy in the network. Average path length is the mean number of edges in the shortest path between all station pairs, reflecting global navigability. Chopra et al. (2016) report $C = 0.035$ and $L = 18.4$ for the full 268-station London Underground network.
A key limitation of this analysis is its purely topological nature, meaning all stations and edges are considered equally important regardless of passenger volume. Chopra et al. (2016) demonstrated that incorporating passenger flow data reveals a different dimension of vulnerability: stations with high passenger throughput but few nearby alternatives (such as Canary Wharf and Stratford) suffer disproportionate disruption even if their topological centrality is moderate. Extending this analysis with passenger flow data would reveal not just which stations are structurally critical, but which closures would most disrupt actual commuter journeys.
2. Flows: Weighted Network
Degree centrality fails to capture edge weight heterogeneity in weighted networks. Node strength, defined as the sum of connected edge weights (Barrat et al., 2004; Newman, 2004), is therefore adopted:
\[s(p_k) = \sum_{i=1}^{n} w(p_i, p_k) \quad (i \neq k)\]where $w(p_i, p_k)$ is the passenger flow on edge $(i, k)$. The station with the highest node strength is Bank and Monument, reflecting its role as the dominant passenger flow hub during workday AM peak.
Weighted betweenness and closeness centrality were computed using the inverse of passenger flows as edge distances. Green Park has the highest weighted betweenness, as its position at the intersection of three high-flow inner-city lines (Jubilee, Victoria, Piccadilly) makes it a critical intermediary on heavily used corridors. Green Park also ranks marginally first in flow-weighted closeness, but the measure exhibits negligible variation across central stations (top-to-398th gap: 0.006%), with only three outlier stations scoring substantially lower.
Overall, the introduction of passenger flow weights shifts the most critical stations from Stratford to Bank and Monument and Green Park. Bank and Monument also ranks first in a supplementary length-weighted betweenness analysis using physical inter-station distances, confirming its role as the geographically central shortest-path intermediary. However, flow-weighted closeness shows limited discriminatory power, as the high-frequency connections between central stations produce near-uniform reachability scores, compressing the distribution and reducing its ability to differentiate critical nodes.
2.1 Stations with Largest Flow and Impact on Passengers
The largest OD flow is from Waterloo to Bank and Monument, with 15,946 passengers during the AM peak (Monday–Thursday, NUMBAT 2019). This concentration is explained by the structure of the Waterloo & City line, a two-station weekday-only shuttle covering just 2.37 km beneath the Thames in four minutes with no intermediate stops. Waterloo is the UK’s busiest railway terminus and Bank and Monument serves the City of London financial district, making this corridor the dominant commuter route in the network.
If Waterloo is closed, 67,372 AM peak passengers originating from the station would be directly affected. If Waterloo is entirely removed as a network node, all passengers whose shortest paths pass through Waterloo would be disrupted, approximated by its node strength of 565,266 flows.
Note: Passengers originating from or destined for Waterloo are counted once, but transfer passengers whose shortest paths pass through Waterloo contribute to both an incoming and an outgoing edge, causing them to be counted twice. Node strength which sums all adjacent edge flows therefore serves as a rough upper-bound approximation of the total disruption scale rather than a precise count of affected passengers.
2.2 Alternative Station Analysis
For the 15,946 AM peak passengers travelling from Waterloo to Bank and Monument via the Waterloo & City line, the line would be rendered entirely non-operational upon station closure. An alternative routing analysis was therefore conducted to identify the optimal substitute station. Total journey time for each candidate station was computed as:
\[T_{\text{total}} = T_{\text{walk}} + T_{\text{access}} + T_{\text{metro}} + T_{\text{transfer}} \times n\]where $T_{\text{walk}} = d_{\text{walk}} / (1.4 \times 60)$ with 1.4 m/s as the mean pedestrian walking speed (Bosina & Weidmann, 2017); $T_{\text{access}} = 4.0$ minutes combines station entry and initial waiting time; $T_{\text{metro}} = d_{\text{metro}} / (33{,}000/60)$ assuming a network-wide average operating speed of 33 km/h (TfL, 2024); $T_{\text{transfer}} = 3.3$ minutes per interchange for transfer walking and waiting (Guo & Wilson, 2011); and $n$ is the number of interchanges required.
15 candidate stations were identified within 2 km walking distance of Waterloo using the OSMnx pedestrian network. For each candidate, walking distance from Waterloo was computed as the shortest path on the pedestrian road network. The shortest underground route to Bank and Monument was then identified by minimising cumulative edge length on the underground network graph, from which total underground distance and transfer times were extracted.
Table 2. Alternative station analysis: journey times from Waterloo to Bank and Monument.
| Station | Walk (m) | Walk (min) | Metro (min) | Transfers | Total (min) |
|---|---|---|---|---|---|
| Embankment | 901 | 10.7 | 5.1 | 0 | 19.8 |
| Southwark | 873 | 10.4 | 3.6 | 1 | 21.3 |
| Lambeth North | 851 | 10.1 | 5.7 | 1 | 23.1 |
| Temple | 1,387 | 16.5 | 3.6 | 0 | 24.1 |
| Blackfriars | 1,548 | 18.4 | 2.3 | 0 | 24.7 |
| Elephant & Castle | 1,482 | 17.6 | 4.0 | 0 | 25.6 |
| Borough | 1,737 | 20.7 | 2.5 | 0 | 27.2 |
| Westminster | 1,251 | 14.9 | 6.2 | 1 | 28.4 |
| Charing Cross | 1,314 | 15.6 | 5.7 | 1 | 28.6 |
| London Bridge | 1,987 | 23.7 | 1.6 | 0 | 29.3 |
| Holborn | 1,916 | 22.8 | 4.6 | 0 | 31.4 |
| Covent Garden | 1,619 | 19.3 | 5.7 | 1 | 32.3 |
| Leicester Square | 1,695 | 20.2 | 6.4 | 1 | 33.9 |
| Piccadilly Circus | 1,896 | 22.6 | 6.7 | 1 | 36.6 |
| St. James’s Park | 1,975 | 23.5 | 7.2 | 2 | 41.3 |
Note: Total time includes $T_{\text{access}} = 4.0$ min and $T_{\text{transfer}} = 3.3$ min per interchange. Walking speed = 1.4 m/s. Underground speed = 33 km/h.
Embankment emerges as the optimal alternative station, with a total journey time of 19.8 minutes, comprising 10.7 minutes walking (901 m) and 5.1 minutes underground via the District or Circle line with no transfers required. Southwark (21.3 min) and Lambeth North (23.1 min) represent viable but less efficient alternatives. By comparison, the direct Waterloo & City line journey, which covers 2.37 km in approximately 4 minutes, would normally complete the same trip in under 10 minutes including access time, meaning the optimal alternative route represents an additional journey time of approximately 10 minutes.
Two limitations should be acknowledged. First, the analysis assumes uncongested conditions, whereas the large volume of displaced passengers would generate crowding effects on both the pedestrian network and alternative lines, extending actual journey times beyond the modelled estimate. Second, a uniform operating speed of 33 km/h was applied across all lines, whereas in practice line speeds vary considerably.
References
Albert, R., Jeong, H., & Barabási, A.-L. (2000). Error and attack tolerance of complex networks. Nature, 406(6794), 378–382. https://doi.org/10.1038/35019019
Barrat, A., Barthélemy, M., Pastor-Satorras, R., & Vespignani, A. (2004). The architecture of complex weighted networks. Proceedings of the National Academy of Sciences, 101(11), 3747–3752. https://doi.org/10.1073/pnas.0400087101
Bosina, E., & Weidmann, U. (2017). Estimating pedestrian speed using aggregated literature data. Physica A: Statistical Mechanics and its Applications, 468, 1–29. https://doi.org/10.1016/j.physa.2016.09.044
Chopra, S. S., Dillon, T., Bilec, M. M., & Khanna, V. (2016). A network-based framework for assessing infrastructure resilience: A case study of the London Metro system. Journal of The Royal Society Interface, 13(118), 20160113. https://doi.org/10.1098/rsif.2016.0113
Freeman, L. C. (1978). Centrality in social networks conceptual clarification. Social Networks, 1(3), 215–239. https://doi.org/10.1016/0378-8733(78)90021-7
Guo, W., & Lu, X. (2016). London underground: Neighbourhood centrality and relation to urban geography. 2016 IEEE International Smart Cities Conference (ISC2), 1–7. https://doi.org/10.1109/ISC2.2016.7580751
Guo, Z., & Wilson, N. H. M. (2011). Assessing the cost of transfer inconvenience in public transport systems: A case study of the London Underground. Transportation Research Part A: Policy and Practice, 45(2), 91–104. https://doi.org/10.1016/j.tra.2010.11.002
Newman, M. E. J. (2004). Analysis of weighted networks. Physical Review E, 70(5), 056131. https://doi.org/10.1103/PhysRevE.70.056131
Nieminen, J. (1974). On the centrality in a graph. Scandinavian Journal of Psychology, 15(1), 332–336. https://doi.org/10.1111/j.1467-9450.1974.tb00598.x
Sabidussi, G. (1966). The centrality index of a graph. Psychometrika, 31(4), 581–603.
Tepsan, W., Phaphuangwittayakul, A., Sokantika, S., & Harnpornchai, N. (2025). Identifying hubs through influential nodes in transportation network by using a gravity centrality approach. Algorithms, 18(6), 356. https://doi.org/10.3390/a18060356
Transport for London. (2024). Facts and figures. https://www.tfl.gov.uk/corporate/about-tfl/what-we-do/london-underground/
von Ferber, C., Berche, B., Holovatch, T., & Holovatch, Y. (2012). A tale of two cities. Journal of Transportation Security, 5(3), 199–216. https://doi.org/10.1007/s12198-012-0092-9