<?xml version="1.0" encoding="utf-8"?><feed xmlns="http://www.w3.org/2005/Atom" ><generator uri="https://jekyllrb.com/" version="3.10.0">Jekyll</generator><link href="https://zhengpei-xu.github.io/feed.xml" rel="self" type="application/atom+xml" /><link href="https://zhengpei-xu.github.io/" rel="alternate" type="text/html" /><updated>2026-05-24T07:41:41+00:00</updated><id>https://zhengpei-xu.github.io/feed.xml</id><title type="html">Zhengpei Xu</title><subtitle>Your Name&apos;s academic portfolio</subtitle><author><name>Zhengpei(Pippin) Xu</name><email>zhengpei_xu@outlook.com</email><uri>https://zhengpei-xu.github.io</uri></author><entry><title type="html">Statistical and ML Metrics Dictionary</title><link href="https://zhengpei-xu.github.io/posts/2026/04/Statistical%20and%20ML%20Metrics%20Dictionary/" rel="alternate" type="text/html" title="Statistical and ML Metrics Dictionary" /><published>2026-04-28T00:00:00+00:00</published><updated>2026-04-28T00:00:00+00:00</updated><id>https://zhengpei-xu.github.io/posts/2026/04/Statistical%20and%20ML%20Metrics%20Dictionary</id><content type="html" xml:base="https://zhengpei-xu.github.io/posts/2026/04/Statistical%20and%20ML%20Metrics%20Dictionary/"><![CDATA[<h2 id="table-of-contents">Table of Contents</h2>

<ul>
  <li><a href="#part-i-statistical-metrics">Part I: Statistical Metrics</a>
    <ul>
      <li><a href="#1-descriptive--distributional-statistics">1. Descriptive &amp; Distributional Statistics</a></li>
      <li><a href="#2-statistical-inference">2. Statistical Inference</a></li>
      <li><a href="#3-correlation--association">3. Correlation &amp; Association</a></li>
      <li><a href="#4-information-theoretic-metrics">4. Information-Theoretic Metrics</a></li>
      <li><a href="#5-glm--count-model-metrics">5. GLM &amp; Count Model Metrics</a></li>
      <li><a href="#6-model-selection-criteria">6. Model Selection Criteria</a></li>
      <li><a href="#7-spatial-statistics">7. Spatial Statistics</a></li>
    </ul>
  </li>
  <li><a href="#part-ii-machine-learning-metrics">Part II: Machine Learning Metrics</a>
    <ul>
      <li><a href="#8-classification--threshold-based">8. Classification — Threshold-Based</a></li>
      <li><a href="#9-classification--threshold-independent">9. Classification — Threshold-Independent</a></li>
      <li><a href="#10-multi-class-extensions">10. Multi-Class Extensions</a></li>
      <li><a href="#11-calibration-metrics">11. Calibration Metrics</a></li>
      <li><a href="#12-regression-metrics">12. Regression Metrics</a></li>
      <li><a href="#13-ranking--retrieval-metrics">13. Ranking &amp; Retrieval Metrics</a></li>
      <li><a href="#14-clustering--external-with-ground-truth">14. Clustering — External (with Ground Truth)</a></li>
      <li><a href="#15-clustering--internal-no-ground-truth">15. Clustering — Internal (No Ground Truth)</a></li>
      <li><a href="#16-model-selection--validation">16. Model Selection &amp; Validation</a></li>
      <li><a href="#17-feature-importance--interpretability">17. Feature Importance &amp; Interpretability</a></li>
      <li><a href="#18-distance--similarity-metrics">18. Distance &amp; Similarity Metrics</a></li>
    </ul>
  </li>
  <li><a href="#appendix-common-notation">Appendix: Common Notation</a></li>
</ul>

<hr />

<h1 id="part-i-statistical-metrics">Part I: Statistical Metrics</h1>

<hr />

<h2 id="1-descriptive--distributional-statistics">1. Descriptive &amp; Distributional Statistics</h2>

<h3 id="mean-arithmetic">Mean (Arithmetic)</h3>

<ul>
  <li><strong>Definition:</strong> The sum of all values divided by the number of values.</li>
</ul>

\[\bar{x} = \frac{1}{N} \sum_{i=1}^{N} x_i\]

<ul>
  <li><strong>Range:</strong> Any real number.</li>
  <li><strong>When to use:</strong> Default summary of central tendency for symmetric, roughly normal distributions. Avoid when data is heavily skewed or contains extreme outliers — use median instead.</li>
</ul>

<hr />

<h3 id="median">Median</h3>

<ul>
  <li><strong>Definition:</strong> The middle value when data are sorted. For even N, the average of the two middle values.</li>
</ul>

\[\text{Median} = \begin{cases} x_{(n+1)/2} &amp; \text{if } N \text{ is odd} \\ \frac{1}{2}\left(x_{N/2} + x_{N/2+1}\right) &amp; \text{if } N \text{ is even} \end{cases}\]

<ul>
  <li><strong>Range:</strong> Any real number.</li>
  <li><strong>When to use:</strong> Preferred over the mean when the distribution is skewed or contains outliers (e.g. income data, travel time distributions, collision counts with long tails).</li>
</ul>

<hr />

<h3 id="mode">Mode</h3>

<ul>
  <li><strong>Definition:</strong> The most frequently occurring value in a dataset.</li>
  <li><strong>Range:</strong> Any value in the dataset.</li>
  <li><strong>When to use:</strong> Useful for categorical data or discrete distributions. Also relevant for identifying peaks in multimodal distributions.</li>
</ul>

<hr />

<h3 id="variance">Variance</h3>

<ul>
  <li><strong>Definition:</strong> The average squared deviation from the mean.</li>
</ul>

\[\sigma^2 = \frac{1}{N} \sum_{i=1}^{N} (x_i - \bar{x})^2 \quad \text{(population)}, \qquad s^2 = \frac{1}{N-1} \sum_{i=1}^{N} (x_i - \bar{x})^2 \quad \text{(sample)}\]

<ul>
  <li><strong>Range:</strong> [0, +∞).</li>
  <li><strong>When to use:</strong> Measures spread. Foundation for many statistical tests. Use sample variance (N−1 denominator) when estimating from a sample.</li>
</ul>

<hr />

<h3 id="standard-deviation">Standard Deviation</h3>

<ul>
  <li><strong>Definition:</strong> The square root of variance. In the same units as the data.</li>
</ul>

\[\sigma = \sqrt{\sigma^2} = \sqrt{\frac{1}{N} \sum_{i=1}^{N} (x_i - \bar{x})^2}\]

<ul>
  <li><strong>Range:</strong> [0, +∞).</li>
  <li><strong>When to use:</strong> The default measure of spread for normally distributed data. More interpretable than variance due to same-unit property.</li>
</ul>

<hr />

<h3 id="skewness">Skewness</h3>

<ul>
  <li><strong>Definition:</strong> Measures the asymmetry of a distribution about its mean.</li>
</ul>

\[\gamma_1 = \frac{1}{N} \sum_{i=1}^{N} \left(\frac{x_i - \bar{x}}{\sigma}\right)^3\]

<ul>
  <li><strong>Range:</strong> (−∞, +∞). 0 = symmetric, positive = right-skewed, negative = left-skewed.</li>
  <li><strong>When to use:</strong> Check before applying methods that assume normality. Heavily skewed data may need transformation (log, Box-Cox) before modelling.</li>
</ul>

<hr />

<h3 id="kurtosis">Kurtosis</h3>

<ul>
  <li><strong>Definition:</strong> Measures the “tailedness” of a distribution — how much of the variance comes from extreme values.</li>
</ul>

\[\gamma_2 = \frac{1}{N} \sum_{i=1}^{N} \left(\frac{x_i - \bar{x}}{\sigma}\right)^4 - 3 \quad \text{(excess kurtosis; normal = 0)}\]

<ul>
  <li><strong>Range:</strong> (−∞, +∞). Positive = heavy tails, negative = light tails.</li>
  <li><strong>When to use:</strong> High kurtosis warns of outlier-prone data. Important when assessing whether standard error estimates are reliable.</li>
</ul>

<hr />

<h3 id="interquartile-range-iqr">Interquartile Range (IQR)</h3>

<ul>
  <li><strong>Definition:</strong> The range between the 25th and 75th percentiles.</li>
</ul>

\[\text{IQR} = Q_3 - Q_1\]

<ul>
  <li><strong>Range:</strong> [0, +∞).</li>
  <li><strong>When to use:</strong> Robust measure of spread that is not influenced by outliers. Used in box plots and for outlier detection (values beyond Q₁ − 1.5·IQR or Q₃ + 1.5·IQR).</li>
</ul>

<hr />

<h3 id="coefficient-of-variation-cv">Coefficient of Variation (CV)</h3>

<ul>
  <li><strong>Definition:</strong> The ratio of the standard deviation to the mean, expressed as a percentage.</li>
</ul>

\[CV = \frac{\sigma}{\bar{x}} \times 100\%\]

<ul>
  <li><strong>Range:</strong> [0, +∞)%.</li>
  <li><strong>When to use:</strong> Comparing variability across datasets with different units or scales. Undefined when mean is zero.</li>
</ul>

<hr />

<h2 id="2-statistical-inference">2. Statistical Inference</h2>

<h3 id="p-value">p-value</h3>

<ul>
  <li><strong>Definition:</strong> The probability of observing a test statistic at least as extreme as the one computed, assuming the null hypothesis is true.</li>
</ul>

\[p = P(T \geq t_{\text{obs}} \mid H_0)\]

<ul>
  <li><strong>Range:</strong> [0, 1]. Smaller = stronger evidence against H₀. Reject H₀ if p &lt; α (commonly 0.05).</li>
  <li><strong>When to use:</strong> Standard hypothesis testing for any parametric or non-parametric test. Be aware that large N can produce small p for trivially small effects — always pair with effect size. <strong>Not</strong> the probability that H₀ is true.</li>
</ul>

<hr />

<h3 id="confidence-interval-ci">Confidence Interval (CI)</h3>

<ul>
  <li><strong>Definition:</strong> A range of values that, under repeated sampling, would contain the true parameter at a given confidence level.</li>
</ul>

\[CI = \hat{\theta} \pm z_{\alpha/2} \times SE(\hat{\theta})\]

<ul>
  <li><strong>Range:</strong> Width depends on SE and confidence level. For 95%: z = 1.96.</li>
  <li><strong>When to use:</strong> Always report alongside point estimates. More informative than p-values alone because it conveys both the magnitude and precision of an estimate.</li>
</ul>

<hr />

<h3 id="effect-size--cohens-d">Effect Size — Cohen’s d</h3>

<ul>
  <li><strong>Definition:</strong> The standardised difference between two group means.</li>
</ul>

\[d = \frac{\bar{x}_1 - \bar{x}_2}{s_{\text{pooled}}}, \qquad s_{\text{pooled}} = \sqrt{\frac{s_1^2 + s_2^2}{2}}\]

<ul>
  <li>
    <table>
      <tbody>
        <tr>
          <td><strong>Range:</strong> (−∞, +∞).</td>
          <td>d</td>
          <td>: 0.2 = small, 0.5 = medium, 0.8 = large.</td>
        </tr>
      </tbody>
    </table>
  </li>
  <li><strong>When to use:</strong> When comparing two groups and you want to quantify the practical significance of the difference, independent of sample size. Essential complement to p-values.</li>
</ul>

<hr />

<h3 id="effect-size--eta-squared-η">Effect Size — Eta Squared (η²)</h3>

<ul>
  <li><strong>Definition:</strong> The proportion of total variance explained by a factor in ANOVA.</li>
</ul>

\[\eta^2 = \frac{SS_{\text{effect}}}{SS_{\text{total}}}\]

<ul>
  <li><strong>Range:</strong> [0, 1]. 0.01 = small, 0.06 = medium, 0.14 = large.</li>
  <li><strong>When to use:</strong> After ANOVA to understand how much of the outcome variation is attributable to the grouping variable.</li>
</ul>

<hr />

<h3 id="wald-test">Wald Test</h3>

<ul>
  <li><strong>Definition:</strong> Tests whether an estimated parameter is significantly different from a hypothesised value (usually zero).</li>
</ul>

\[W = \frac{(\hat{\theta} - \theta_0)^2}{\text{Var}(\hat{\theta})} \sim \chi^2(1)\]

<ul>
  <li><strong>Range:</strong> χ² statistic.</li>
  <li><strong>When to use:</strong> Testing individual coefficient significance in GLMs and logistic regression. Faster to compute than the likelihood ratio test but less reliable for small samples.</li>
</ul>

<hr />

<h3 id="likelihood-ratio-test-lrt">Likelihood Ratio Test (LRT)</h3>

<ul>
  <li><strong>Definition:</strong> Compares two nested models by testing whether the additional parameters significantly improve the fit.</li>
</ul>

\[LR = -2 \left[ \ell(\text{reduced}) - \ell(\text{full}) \right] \sim \chi^2(df)\]

<ul>
  <li><strong>Range:</strong> [0, +∞). df = difference in number of parameters. Significant if p &lt; α.</li>
  <li><strong>When to use:</strong> When comparing a simpler (nested) model against a more complex one — e.g. testing whether adding a variable improves a logistic regression or Poisson GLM. Generally preferred over the Wald test for small samples.</li>
</ul>

<hr />

<h3 id="chi-squared-test-of-independence">Chi-Squared Test of Independence</h3>

<ul>
  <li><strong>Definition:</strong> Tests whether two categorical variables are independent.</li>
</ul>

\[\chi^2 = \sum \frac{(O_i - E_i)^2}{E_i}\]

<ul>
  <li><strong>Range:</strong> [0, +∞).</li>
  <li><strong>When to use:</strong> Contingency table analysis with categorical variables. Requires expected cell counts ≥ 5; use Fisher’s exact test otherwise.</li>
</ul>

<hr />

<h3 id="fishers-exact-test">Fisher’s Exact Test</h3>

<ul>
  <li><strong>Definition:</strong> An exact test for independence in a 2×2 contingency table, based on the hypergeometric distribution.</li>
  <li><strong>Range:</strong> p-value in [0, 1].</li>
  <li><strong>When to use:</strong> Small sample sizes where χ² approximation is unreliable, or when any expected cell count is below 5.</li>
</ul>

<hr />

<h3 id="t-test-independent--paired">t-test (Independent / Paired)</h3>

<ul>
  <li><strong>Definition:</strong> Tests whether the means of one or two groups differ significantly.</li>
</ul>

\[t = \frac{\bar{x}_1 - \bar{x}_2}{\sqrt{\dfrac{s_1^2}{n_1} + \dfrac{s_2^2}{n_2}}} \quad \text{(Welch's independent t-test)}\]

<ul>
  <li><strong>Range:</strong> t statistic → p-value.</li>
  <li><strong>When to use:</strong> Comparing means of two groups (independent) or before-and-after measurements (paired). Assumes approximate normality for small samples; robust for large N. Use Welch’s variant when variances are unequal.</li>
</ul>

<hr />

<h3 id="mann-whitney-u-test">Mann-Whitney U Test</h3>

<ul>
  <li><strong>Definition:</strong> A non-parametric test comparing the distributions of two independent groups using ranks.</li>
  <li><strong>Range:</strong> U statistic → p-value.</li>
  <li><strong>When to use:</strong> Alternative to the independent t-test when the normality assumption is violated, data is ordinal, or the distribution is heavily skewed.</li>
</ul>

<hr />

<h3 id="kruskal-wallis-test">Kruskal-Wallis Test</h3>

<ul>
  <li><strong>Definition:</strong> Non-parametric extension of one-way ANOVA for comparing three or more independent groups.</li>
  <li><strong>Range:</strong> H statistic → p-value.</li>
  <li><strong>When to use:</strong> When comparing more than two groups and the assumptions of ANOVA (normality, homoscedasticity) are not met.</li>
</ul>

<hr />

<h3 id="shapiro-wilk-test">Shapiro-Wilk Test</h3>

<ul>
  <li><strong>Definition:</strong> Tests whether a sample comes from a normally distributed population.</li>
  <li><strong>Range:</strong> W statistic in (0, 1]; associated p-value.</li>
  <li><strong>When to use:</strong> Before applying parametric tests that assume normality. Most powerful normality test for small to moderate samples (N &lt; 5000).</li>
</ul>

<hr />

<h3 id="levenes-test">Levene’s Test</h3>

<ul>
  <li><strong>Definition:</strong> Tests equality of variances across groups (homoscedasticity).</li>
  <li><strong>Range:</strong> F statistic → p-value.</li>
  <li><strong>When to use:</strong> Before ANOVA or t-test to check whether the equal-variance assumption holds. More robust to departures from normality than Bartlett’s test.</li>
</ul>

<hr />

<h3 id="durbin-watson-test">Durbin-Watson Test</h3>

<ul>
  <li><strong>Definition:</strong> Tests for first-order autocorrelation in regression residuals.</li>
</ul>

\[DW = \frac{\sum_{t=2}^{N} (e_t - e_{t-1})^2}{\sum_{t=1}^{N} e_t^2}\]

<ul>
  <li><strong>Range:</strong> [0, 4]. DW ≈ 2 = no autocorrelation. DW &lt; 2 = positive, DW &gt; 2 = negative.</li>
  <li><strong>When to use:</strong> After fitting a regression model to time-series or sequentially ordered data. Violated autocorrelation inflates standard errors and invalidates inference.</li>
</ul>

<hr />

<h2 id="3-correlation--association">3. Correlation &amp; Association</h2>

<h3 id="pearson-correlation-r">Pearson Correlation (r)</h3>

<ul>
  <li><strong>Definition:</strong> Measures the linear relationship between two continuous variables.</li>
</ul>

\[r = \frac{\sum (x_i - \bar{x})(y_i - \bar{y})}{\sqrt{\sum (x_i - \bar{x})^2 \cdot \sum (y_i - \bar{y})^2}}\]

<ul>
  <li>
    <table>
      <tbody>
        <tr>
          <td><strong>Range:</strong> [−1, 1].</td>
          <td>r</td>
          <td>&gt; 0.7 typically considered strong.</td>
        </tr>
      </tbody>
    </table>
  </li>
  <li><strong>When to use:</strong> Both variables are continuous and the relationship is approximately linear. Sensitive to outliers.</li>
</ul>

<hr />

<h3 id="spearman-rank-correlation-ρ">Spearman Rank Correlation (ρ)</h3>

<ul>
  <li><strong>Definition:</strong> Measures monotonic (not necessarily linear) relationship between two variables using ranks.</li>
</ul>

\[\rho = 1 - \frac{6 \sum d_i^2}{N(N^2 - 1)}, \qquad d_i = \text{rank}(x_i) - \text{rank}(y_i)\]

<ul>
  <li><strong>Range:</strong> [−1, 1].</li>
  <li><strong>When to use:</strong> When the relationship is monotonic but not linear, when data is ordinal, or when outliers are present. Non-parametric alternative to Pearson.</li>
</ul>

<hr />

<h3 id="kendalls-tau-τ">Kendall’s Tau (τ)</h3>

<ul>
  <li><strong>Definition:</strong> Measures ordinal association based on concordant and discordant pairs.</li>
</ul>

\[\tau = \frac{(\text{concordant pairs}) - (\text{discordant pairs})}{\binom{N}{2}}\]

<ul>
  <li><strong>Range:</strong> [−1, 1].</li>
  <li><strong>When to use:</strong> Small samples, ordinal data, or when there are many tied ranks. More robust than Spearman in small datasets.</li>
</ul>

<hr />

<h3 id="point-biserial-correlation">Point-Biserial Correlation</h3>

<ul>
  <li><strong>Definition:</strong> Pearson correlation between a continuous and a dichotomous variable.</li>
  <li><strong>Range:</strong> [−1, 1].</li>
  <li><strong>When to use:</strong> Assessing the relationship between a binary variable (e.g. collision / no collision) and a continuous predictor.</li>
</ul>

<hr />

<h3 id="cramérs-v">Cramér’s V</h3>

<ul>
  <li><strong>Definition:</strong> Measures the strength of association between two nominal (categorical) variables.</li>
</ul>

\[V = \sqrt{\frac{\chi^2}{N \cdot (\min(r, c) - 1)}}\]

<ul>
  <li><strong>Range:</strong> [0, 1]. 0 = no association, 1 = perfect.</li>
  <li><strong>When to use:</strong> After a chi-squared test on a contingency table to quantify association strength. Works for tables larger than 2×2.</li>
</ul>

<hr />

<h2 id="4-information-theoretic-metrics">4. Information-Theoretic Metrics</h2>

<h3 id="entropy">Entropy</h3>

<ul>
  <li><strong>Definition:</strong> Measures the uncertainty or disorder in a probability distribution.</li>
</ul>

\[H(X) = -\sum p(x) \log_2 p(x)\]

<ul>
  <li><strong>Range:</strong> [0, log₂(n)]. 0 = deterministic, max = uniform distribution.</li>
  <li><strong>When to use:</strong> Quantifying uncertainty in a categorical variable. Used in decision tree splitting (information gain) and as a baseline for mutual information.</li>
</ul>

<hr />

<h3 id="cross-entropy">Cross-Entropy</h3>

<ul>
  <li><strong>Definition:</strong> The average number of bits needed to encode data from distribution p using a code optimised for distribution q.</li>
</ul>

\[H(p, q) = -\sum p(x) \log q(x)\]

<ul>
  <li><strong>Range:</strong> [H(p), +∞). Minimised when q = p.</li>
  <li><strong>When to use:</strong> Standard loss function for classification models. Equivalent to negative log-likelihood.</li>
</ul>

<hr />

<h3 id="kl-divergence-kullback-leibler">KL Divergence (Kullback-Leibler)</h3>

<ul>
  <li><strong>Definition:</strong> Measures how one probability distribution diverges from a reference distribution.</li>
</ul>

\[D_{KL}(p \| q) = \sum p(x) \log \frac{p(x)}{q(x)}\]

<ul>
  <li><strong>Range:</strong> [0, +∞). 0 = identical distributions.</li>
  <li><strong>When to use:</strong> Comparing a learned distribution against a reference (e.g. in variational inference, generative models). Note: asymmetric — D_KL(p‖q) ≠ D_KL(q‖p).</li>
</ul>

<hr />

<h3 id="mutual-information">Mutual Information</h3>

<ul>
  <li><strong>Definition:</strong> Quantifies the amount of information shared between two variables.</li>
</ul>

\[I(X; Y) = \sum_x \sum_y p(x,y) \log \frac{p(x,y)}{p(x) \cdot p(y)} = H(X) + H(Y) - H(X,Y)\]

<ul>
  <li><strong>Range:</strong> [0, min(H(X), H(Y))]. 0 = independent.</li>
  <li><strong>When to use:</strong> Feature selection (detecting non-linear dependencies), clustering evaluation (NMI), and measuring information overlap. More general than correlation — captures any statistical dependence.</li>
</ul>

<hr />

<h3 id="jensen-shannon-divergence">Jensen-Shannon Divergence</h3>

<ul>
  <li><strong>Definition:</strong> A symmetric, bounded version of KL divergence.</li>
</ul>

\[JSD(p \| q) = \frac{1}{2} D_{KL}(p \| m) + \frac{1}{2} D_{KL}(q \| m), \qquad m = \frac{1}{2}(p + q)\]

<ul>
  <li><strong>Range:</strong> [0, 1] (when using log₂). 0 = identical.</li>
  <li><strong>When to use:</strong> When you need a symmetric measure of distributional difference. Its square root is a proper distance metric.</li>
</ul>

<hr />

<h2 id="5-glm--count-model-metrics">5. GLM &amp; Count Model Metrics</h2>

<h3 id="deviance">Deviance</h3>

<ul>
  <li><strong>Definition:</strong> Twice the difference between the log-likelihood of the saturated model and the fitted model. Generalises the residual sum of squares to GLMs.</li>
</ul>

\[D = 2 \left[ \ell(\text{saturated}) - \ell(\text{fitted}) \right]\]

\[\text{For Poisson:} \quad D = 2 \sum \left[ y_i \log\frac{y_i}{\mu_i} - (y_i - \mu_i) \right]\]

<ul>
  <li><strong>Range:</strong> [0, +∞). Lower = better fit.</li>
  <li><strong>When to use:</strong> Assessing goodness-of-fit for GLMs (Poisson, logistic, negative binomial). The null deviance (intercept-only) minus residual deviance indicates variance explained.</li>
</ul>

<hr />

<h3 id="pearson-chi-squared-statistic">Pearson Chi-Squared Statistic</h3>

<ul>
  <li><strong>Definition:</strong> Sum of squared Pearson residuals. Tests whether observed counts deviate from model expectations.</li>
</ul>

\[X^2 = \sum \frac{(y_i - \mu_i)^2}{\mu_i}\]

<ul>
  <li><strong>Range:</strong> [0, +∞).</li>
  <li><strong>When to use:</strong> Assessing fit of count models. X²/df approximates the overdispersion parameter — if substantially &gt; 1, the Poisson variance assumption may be violated.</li>
</ul>

<hr />

<h3 id="overdispersion-parameter-φ̂">Overdispersion Parameter (φ̂)</h3>

<ul>
  <li><strong>Definition:</strong> Ratio of the Pearson χ² statistic to residual degrees of freedom.</li>
</ul>

\[\hat{\varphi} = \frac{X^2}{N - p}\]

<ul>
  <li><strong>Range:</strong> [0, +∞). φ ≈ 1 = equidispersion.</li>
  <li><strong>When to use:</strong> After fitting a Poisson model. φ̂ » 1 indicates overdispersion (variance &gt; mean) — switch to Negative Binomial or Quasi-Poisson. φ̂ « 1 suggests underdispersion.</li>
</ul>

<hr />

<h3 id="pseudo-r-mcfadden">Pseudo-R² (McFadden)</h3>

<ul>
  <li><strong>Definition:</strong> An R²-like goodness-of-fit measure for GLMs based on log-likelihood comparison with the null model.</li>
</ul>

\[R^2_{\text{McFadden}} = 1 - \frac{\ell(\text{fitted})}{\ell(\text{null})}\]

<ul>
  <li><strong>Range:</strong> [0, 1). Values of 0.2–0.4 are considered excellent.</li>
  <li><strong>When to use:</strong> Reporting model explanatory power for logistic regression, Poisson GLMs, etc. Not directly comparable to OLS R². Other variants (Nagelkerke, Cox-Snell, Efron) exist — always specify which.</li>
</ul>

<hr />

<h3 id="hosmer-lemeshow-test">Hosmer-Lemeshow Test</h3>

<ul>
  <li><strong>Definition:</strong> Groups predictions into deciles and compares observed vs expected outcomes to assess logistic regression calibration.</li>
</ul>

\[HL = \sum_{g=1}^{G} \frac{(O_g - E_g)^2}{E_g \cdot (1 - E_g / n_g)} \sim \chi^2(G - 2)\]

<ul>
  <li><strong>Range:</strong> χ² statistic. Non-significant p = good calibration.</li>
  <li><strong>When to use:</strong> After logistic regression to check whether predicted probabilities match observed frequencies. Losing favour to ECE in modern ML but still standard in epidemiology and public health.</li>
</ul>

<hr />

<h3 id="vuong-test">Vuong Test</h3>

<ul>
  <li><strong>Definition:</strong> A non-nested model comparison test.</li>
</ul>

\[V = \frac{\sqrt{N} \cdot \bar{m}}{s_m}, \qquad m_i = \log\frac{f_1(y_i)}{f_2(y_i)}\]

<ul>
  <li>
    <table>
      <tbody>
        <tr>
          <td><strong>Range:</strong> Z-statistic.</td>
          <td>V</td>
          <td>&gt; 1.96 suggests one model significantly better.</td>
        </tr>
      </tbody>
    </table>
  </li>
  <li><strong>When to use:</strong> Comparing non-nested count models — e.g. standard Poisson vs Zero-Inflated Poisson (ZIP), or Poisson vs Negative Binomial.</li>
</ul>

<hr />

<h2 id="6-model-selection-criteria">6. Model Selection Criteria</h2>

<h3 id="aic-akaike-information-criterion">AIC (Akaike Information Criterion)</h3>

<ul>
  <li><strong>Definition:</strong> Balances goodness-of-fit (log-likelihood) against model complexity.</li>
</ul>

\[AIC = -2\,\ell(\hat{\theta}) + 2k\]

<ul>
  <li><strong>Range:</strong> (−∞, +∞). Lower is better (relative measure). k = number of estimated parameters.</li>
  <li><strong>When to use:</strong> Comparing models fitted on the <strong>same</strong> dataset. Favours predictive accuracy; tends to select slightly more complex models than BIC. Standard in ecology, spatial modelling, and epidemiology.</li>
</ul>

<hr />

<h3 id="bic-bayesian-information-criterion">BIC (Bayesian Information Criterion)</h3>

<ul>
  <li><strong>Definition:</strong> Similar to AIC but with a stronger complexity penalty that depends on sample size.</li>
</ul>

\[BIC = -2\,\ell(\hat{\theta}) + k \ln(N)\]

<ul>
  <li><strong>Range:</strong> (−∞, +∞). Lower is better.</li>
  <li><strong>When to use:</strong> When you want a more parsimonious model than AIC selects, especially with large N. Asymptotically consistent (selects the true model as N → ∞). Penalises complexity more than AIC when N &gt; 7.</li>
</ul>

<hr />

<h3 id="aicc-corrected-aic">AICc (Corrected AIC)</h3>

<ul>
  <li><strong>Definition:</strong> AIC with a finite-sample correction.</li>
</ul>

\[AIC_c = AIC + \frac{2k^2 + 2k}{N - k - 1}\]

<ul>
  <li><strong>Range:</strong> (−∞, +∞). Lower is better.</li>
  <li><strong>When to use:</strong> When the sample size is small relative to the number of parameters (rule of thumb: N/k &lt; 40). Converges to AIC as N → ∞.</li>
</ul>

<hr />

<h2 id="7-spatial-statistics">7. Spatial Statistics</h2>

<h3 id="morans-i-global">Moran’s I (Global)</h3>

<ul>
  <li><strong>Definition:</strong> A measure of global spatial autocorrelation — whether similar values cluster together in space.</li>
</ul>

\[I = \frac{N}{S_0} \cdot \frac{\sum_i \sum_j w_{ij}(x_i - \bar{x})(x_j - \bar{x})}{\sum_i (x_i - \bar{x})^2}, \qquad S_0 = \sum_i \sum_j w_{ij}\]

<ul>
  <li><strong>Range:</strong> Approx [−1, 1]. Positive = clustering, near 0 = random, negative = dispersion.</li>
  <li><strong>When to use:</strong> Testing whether a spatial pattern (e.g. collision rates, traffic stress scores) exhibits significant clustering or dispersion. First step in exploratory spatial data analysis (ESDA). Requires defining a spatial weights matrix W.</li>
</ul>

<hr />

<h3 id="gearys-c">Geary’s C</h3>

<ul>
  <li><strong>Definition:</strong> An alternative to Moran’s I, more sensitive to local differences than global patterns.</li>
</ul>

\[C = \frac{(N-1)}{2 S_0} \cdot \frac{\sum_i \sum_j w_{ij}(x_i - x_j)^2}{\sum_i (x_i - \bar{x})^2}\]

<ul>
  <li><strong>Range:</strong> [0, 2]. C &lt; 1 = positive autocorrelation, C = 1 = random, C &gt; 1 = negative.</li>
  <li><strong>When to use:</strong> When you care about local dissimilarity rather than global pattern. Inversely related to Moran’s I but captures different spatial features.</li>
</ul>

<hr />

<h3 id="local-morans-i-lisa--local-indicator-of-spatial-association">Local Moran’s I (LISA — Local Indicator of Spatial Association)</h3>

<ul>
  <li><strong>Definition:</strong> Identifies local clusters and spatial outliers at each location.</li>
</ul>

\[I_i = z_i \sum_j w_{ij} z_j, \qquad z_i = \frac{x_i - \bar{x}}{\sigma}\]

<ul>
  <li><strong>Range:</strong> Positive = local cluster (HH or LL), negative = spatial outlier (HL or LH).</li>
  <li><strong>When to use:</strong> Identifying where significant spatial clusters or outliers exist — e.g. collision hotspots (High-High), unexpectedly safe areas near dangerous ones (Low-High). Produces a cluster map with four quadrants.</li>
</ul>

<hr />

<h3 id="getis-ord-gi-hotspot-statistic">Getis-Ord Gi* (Hotspot Statistic)</h3>

<ul>
  <li><strong>Definition:</strong> Identifies statistically significant spatial clusters of high values (hotspots) and low values (coldspots).</li>
</ul>

\[G_i^* = \frac{\sum_j w_{ij} x_j - \bar{X} \sum_j w_{ij}}{S \sqrt{\dfrac{N \sum_j w_{ij}^2 - \left(\sum_j w_{ij}\right)^2}{N - 1}}}\]

<ul>
  <li>
    <table>
      <tbody>
        <tr>
          <td><strong>Range:</strong> Z-score.</td>
          <td>Gi*</td>
          <td>&gt; 1.96 is significant at 95%.</td>
        </tr>
      </tbody>
    </table>
  </li>
  <li><strong>When to use:</strong> Hotspot mapping. Unlike LISA, Gi* identifies concentrations of high or low values (not dissimilarity). Standard tool for identifying collision hotspots, crime hotspots, disease clusters.</li>
</ul>

<hr />

<h3 id="ripleys-k-function">Ripley’s K Function</h3>

<ul>
  <li><strong>Definition:</strong> Evaluates whether a point pattern is clustered, random, or dispersed at various spatial scales.</li>
</ul>

\[K(d) = \frac{A}{N^2} \sum_i \sum_{j \neq i} \mathbf{1}(d_{ij} \leq d)\]

<ul>
  <li><strong>Range:</strong> K(d) &gt; πd² indicates clustering at distance d.</li>
  <li><strong>When to use:</strong> Analysing point patterns (e.g. collision locations) across multiple distance scales. The L function — L(d) = √(K(d)/π) − d — is easier to interpret (L &gt; 0 = clustered).</li>
</ul>

<hr />

<h3 id="semivariogram">Semivariogram</h3>

<ul>
  <li><strong>Definition:</strong> Describes how spatial dependence changes with distance. The foundation of geostatistics.</li>
</ul>

\[\gamma(h) = \frac{1}{2|N(h)|} \sum_{N(h)} \left[ z(s_i) - z(s_j) \right]^2\]

<ul>
  <li><strong>Range:</strong> [0, +∞). Key parameters: nugget (intercept), sill (asymptote), range (distance at which spatial dependence vanishes).</li>
  <li><strong>When to use:</strong> Before kriging or any geostatistical interpolation. Characterises the spatial structure of continuous data — determines how far apart points must be before they become independent.</li>
</ul>

<hr />

<h3 id="spatial-lag-model-diagnostics-lm-tests">Spatial Lag Model Diagnostics (LM Tests)</h3>

<ul>
  <li><strong>Definition:</strong> Lagrange Multiplier tests for spatial dependence in regression residuals. LM-Lag tests for spatial lag (endogenous interaction), LM-Error tests for spatial error (correlated errors).</li>
  <li><strong>Range:</strong> χ² statistic → p-value.</li>
  <li><strong>When to use:</strong> After OLS regression on spatial data to determine whether a spatial lag model, spatial error model, or both are needed. The robust versions (RLM-Lag, RLM-Error) help distinguish between the two.</li>
</ul>

<hr />

<h3 id="spatial-weights-matrix-w">Spatial Weights Matrix (W)</h3>

<ul>
  <li><strong>Definition:</strong> Encodes the spatial neighbourhood structure. Common types: contiguity (queen, rook), distance-based (k-nearest, distance band), kernel.</li>
  <li><strong>When to use:</strong> Required for computing Moran’s I, LISA, Gi*, and spatial regression models. The choice of W affects results — always perform sensitivity analysis with alternative specifications.</li>
</ul>

<hr />

<h1 id="part-ii-machine-learning-metrics">Part II: Machine Learning Metrics</h1>

<hr />

<h2 id="8-classification--threshold-based">8. Classification — Threshold-Based</h2>

<h3 id="accuracy">Accuracy</h3>

<ul>
  <li><strong>Definition:</strong> The proportion of all predictions that are correct.</li>
</ul>

\[\text{Accuracy} = \frac{TP + TN}{TP + TN + FP + FN}\]

<ul>
  <li><strong>Range:</strong> [0, 1]. Higher is better.</li>
  <li><strong>When to use:</strong> Only when classes are roughly balanced. <strong>Avoid</strong> for imbalanced datasets — a model always predicting the majority class can score high accuracy while being useless.</li>
</ul>

<hr />

<h3 id="precision-positive-predictive-value">Precision (Positive Predictive Value)</h3>

<ul>
  <li><strong>Definition:</strong> Of all instances predicted positive, the proportion truly positive.</li>
</ul>

\[\text{Precision} = \frac{TP}{TP + FP}\]

<ul>
  <li><strong>Range:</strong> [0, 1].</li>
  <li><strong>When to use:</strong> When the <strong>cost of false positives is high</strong> — e.g. spam detection, medical screening follow-up costs. Answers: “When the model says positive, how often is it correct?”</li>
</ul>

<hr />

<h3 id="recall-sensitivity--true-positive-rate">Recall (Sensitivity / True Positive Rate)</h3>

<ul>
  <li><strong>Definition:</strong> Of all actual positive instances, the proportion correctly identified.</li>
</ul>

\[\text{Recall} = \frac{TP}{TP + FN}\]

<ul>
  <li><strong>Range:</strong> [0, 1].</li>
  <li><strong>When to use:</strong> When <strong>missing a positive case is costly</strong> — e.g. disease screening, fraud detection, safety-critical systems. Answers: “Of all actual positives, how many did we catch?”</li>
</ul>

<hr />

<h3 id="specificity-true-negative-rate">Specificity (True Negative Rate)</h3>

<ul>
  <li><strong>Definition:</strong> Of all actual negatives, the proportion correctly identified.</li>
</ul>

\[\text{Specificity} = \frac{TN}{TN + FP} = 1 - FPR\]

<ul>
  <li><strong>Range:</strong> [0, 1].</li>
  <li><strong>When to use:</strong> When correctly identifying negatives matters — e.g. ruling out a condition. Paired with sensitivity in diagnostic test evaluation.</li>
</ul>

<hr />

<h3 id="f1-score">F1 Score</h3>

<ul>
  <li><strong>Definition:</strong> Harmonic mean of precision and recall.</li>
</ul>

\[F_1 = 2 \cdot \frac{\text{Precision} \times \text{Recall}}{\text{Precision} + \text{Recall}}\]

<ul>
  <li><strong>Range:</strong> [0, 1].</li>
  <li><strong>When to use:</strong> When you need a <strong>single balanced metric</strong> for precision and recall. Standard choice for imbalanced classification when both false positives and false negatives matter.</li>
</ul>

<hr />

<h3 id="f-beta-score">F-beta Score</h3>

<ul>
  <li><strong>Definition:</strong> Generalisation of F1 that allows tuning the precision-recall trade-off via β.</li>
</ul>

\[F_\beta = (1 + \beta^2) \cdot \frac{\text{Precision} \times \text{Recall}}{\beta^2 \cdot \text{Precision} + \text{Recall}}\]

<ul>
  <li><strong>Range:</strong> [0, 1].</li>
  <li><strong>When to use:</strong> β &gt; 1 when <strong>recall matters more</strong> (e.g. F₂ for safety-critical applications where missing a dangerous case is worse than a false alarm). β &lt; 1 when precision matters more (e.g. F₀.₅).</li>
</ul>

<hr />

<h3 id="matthews-correlation-coefficient-mcc">Matthews Correlation Coefficient (MCC)</h3>

<ul>
  <li><strong>Definition:</strong> A correlation coefficient between observed and predicted binary classifications using all four confusion matrix cells.</li>
</ul>

\[MCC = \frac{TP \cdot TN - FP \cdot FN}{\sqrt{(TP+FP)(TP+FN)(TN+FP)(TN+FN)}}\]

<ul>
  <li><strong>Range:</strong> [−1, +1]. +1 = perfect, 0 = random, −1 = total disagreement.</li>
  <li><strong>When to use:</strong> Widely regarded as the <strong>best single metric for imbalanced binary classification</strong>. Unlike F1, it uses all four quadrants of the confusion matrix and is symmetric between positive and negative classes.</li>
</ul>

<hr />

<h3 id="cohens-kappa-κ">Cohen’s Kappa (κ)</h3>

<ul>
  <li><strong>Definition:</strong> Agreement between predicted and actual labels, adjusted for agreement occurring by chance.</li>
</ul>

\[\kappa = \frac{p_o - p_e}{1 - p_e}\]

<ul>
  <li><strong>Range:</strong> [−1, +1]. 1 = perfect, 0 = no better than chance. p_o = observed accuracy, p_e = expected random accuracy.</li>
  <li><strong>When to use:</strong> Comparing a classifier against random chance or comparing two classifiers/raters. Also used in inter-rater reliability studies. Accounts for class prevalence.</li>
</ul>

<hr />

<h3 id="balanced-accuracy">Balanced Accuracy</h3>

<ul>
  <li><strong>Definition:</strong> The arithmetic mean of recall for each class.</li>
</ul>

\[\text{Balanced Accuracy} = \frac{\text{Sensitivity} + \text{Specificity}}{2}\]

<ul>
  <li><strong>Range:</strong> [0, 1].</li>
  <li><strong>When to use:</strong> A simple adjustment to accuracy for <strong>imbalanced datasets</strong>. Equivalent to accuracy if classes are balanced. Less informative than MCC but more intuitive.</li>
</ul>

<hr />

<h3 id="false-positive-rate-fpr--fall-out">False Positive Rate (FPR / Fall-out)</h3>

<ul>
  <li><strong>Definition:</strong> Of all actual negatives, the proportion incorrectly classified as positive.</li>
</ul>

\[FPR = \frac{FP}{FP + TN} = 1 - \text{Specificity}\]

<ul>
  <li><strong>Range:</strong> [0, 1]. Lower is better.</li>
  <li><strong>When to use:</strong> X-axis of the ROC curve. Important when the cost of false alarms is relevant.</li>
</ul>

<hr />

<h3 id="false-negative-rate-fnr--miss-rate">False Negative Rate (FNR / Miss Rate)</h3>

<ul>
  <li><strong>Definition:</strong> Of all actual positives, the proportion missed.</li>
</ul>

\[FNR = \frac{FN}{FN + TP} = 1 - \text{Recall}\]

<ul>
  <li><strong>Range:</strong> [0, 1]. Lower is better.</li>
  <li><strong>When to use:</strong> Safety-critical systems where missed detections have severe consequences.</li>
</ul>

<hr />

<h3 id="negative-predictive-value-npv">Negative Predictive Value (NPV)</h3>

<ul>
  <li><strong>Definition:</strong> Of all instances predicted negative, the proportion truly negative.</li>
</ul>

\[NPV = \frac{TN}{TN + FN}\]

<ul>
  <li><strong>Range:</strong> [0, 1].</li>
  <li><strong>When to use:</strong> When a negative prediction must be trustworthy — e.g. “this road segment is safe” needs to be reliable.</li>
</ul>

<hr />

<h2 id="9-classification--threshold-independent">9. Classification — Threshold-Independent</h2>

<h3 id="auc-roc-area-under-the-roc-curve">AUC-ROC (Area Under the ROC Curve)</h3>

<ul>
  <li><strong>Definition:</strong> Area under the Receiver Operating Characteristic curve (TPR vs FPR across all thresholds).</li>
</ul>

\[AUC = \int_0^1 TPR(FPR)\, d(FPR) = P(\text{score}_{+} &gt; \text{score}_{-})\]

<ul>
  <li><strong>Range:</strong> [0, 1]. 0.5 = random, 1.0 = perfect.</li>
  <li><strong>When to use:</strong> Comparing overall discriminative ability of classifiers regardless of threshold. Works well when <strong>classes are balanced</strong>. For imbalanced data, AUC-PR is more informative.</li>
</ul>

<hr />

<h3 id="auc-pr-area-under-the-precision-recall-curve">AUC-PR (Area Under the Precision-Recall Curve)</h3>

<ul>
  <li><strong>Definition:</strong> Area under the Precision-Recall curve across all thresholds.</li>
</ul>

\[AUC\text{-}PR = \int_0^1 \text{Precision}(R)\, dR\]

<ul>
  <li><strong>Range:</strong> [0, 1]. Baseline = class prevalence (not 0.5).</li>
  <li><strong>When to use:</strong> When the <strong>positive class is rare</strong> — e.g. fatal collisions, fraud, rare events. More sensitive to performance differences on the minority class than AUC-ROC.</li>
</ul>

<hr />

<h3 id="average-precision-ap">Average Precision (AP)</h3>

<ul>
  <li><strong>Definition:</strong> Discrete approximation of AUC-PR — weighted mean of precisions at each threshold.</li>
</ul>

\[AP = \sum_n (R_n - R_{n-1}) \cdot P_n\]

<ul>
  <li><strong>Range:</strong> [0, 1].</li>
  <li><strong>When to use:</strong> Same as AUC-PR. Standard metric in object detection (mAP) and information retrieval.</li>
</ul>

<hr />

<h3 id="log-loss-binary-cross-entropy">Log Loss (Binary Cross-Entropy)</h3>

<ul>
  <li><strong>Definition:</strong> Penalises the deviation of predicted probabilities from actual labels. Heavily punishes confident wrong predictions.</li>
</ul>

\[\text{LogLoss} = -\frac{1}{N} \sum_{i=1}^{N} \left[ y_i \log(p_i) + (1-y_i) \log(1-p_i) \right]\]

<ul>
  <li><strong>Range:</strong> [0, +∞). Lower is better. 0 = perfect.</li>
  <li><strong>When to use:</strong> When the model outputs <strong>probabilities</strong> and you care about calibration, not just ranking. Standard training loss for logistic regression and neural network classifiers.</li>
</ul>

<hr />

<h3 id="brier-score">Brier Score</h3>

<ul>
  <li><strong>Definition:</strong> Mean squared difference between predicted probabilities and actual binary outcomes.</li>
</ul>

\[BS = \frac{1}{N} \sum_{i=1}^{N} (p_i - y_i)^2\]

<ul>
  <li><strong>Range:</strong> [0, 1]. Lower is better.</li>
  <li><strong>When to use:</strong> Evaluating <strong>probabilistic forecasts</strong>. Decomposes into calibration + refinement + uncertainty, enabling diagnosis of why a model performs poorly.</li>
</ul>

<hr />

<h3 id="ks-statistic-kolmogorov-smirnov">KS Statistic (Kolmogorov-Smirnov)</h3>

<ul>
  <li><strong>Definition:</strong> Maximum vertical distance between the CDFs of positive and negative class scores.</li>
</ul>

\[KS = \max_x \left| F_{+}(x) - F_{-}(x) \right|\]

<ul>
  <li><strong>Range:</strong> [0, 1]. Higher = better separation.</li>
  <li><strong>When to use:</strong> Credit scoring, risk modelling. Identifies the threshold with maximum class separation. Common in financial model validation.</li>
</ul>

<hr />

<h2 id="10-multi-class-extensions">10. Multi-Class Extensions</h2>

<h3 id="macro-averaged-precision--recall--f1">Macro-Averaged Precision / Recall / F1</h3>

<ul>
  <li><strong>Definition:</strong> Compute the metric independently per class, then take the unweighted mean.</li>
</ul>

\[\text{Macro-}F_1 = \frac{1}{C} \sum_{c=1}^{C} F_{1,c}\]

<ul>
  <li><strong>Range:</strong> [0, 1].</li>
  <li><strong>When to use:</strong> When <strong>all classes are equally important</strong> regardless of their size. Gives equal weight to rare and common classes.</li>
</ul>

<hr />

<h3 id="micro-averaged-precision--recall--f1">Micro-Averaged Precision / Recall / F1</h3>

<ul>
  <li><strong>Definition:</strong> Aggregate TP, FP, FN globally across all classes, then compute.</li>
</ul>

\[\text{Micro-Precision} = \frac{\sum_c TP_c}{\sum_c (TP_c + FP_c)}, \qquad \text{Micro-Recall} = \frac{\sum_c TP_c}{\sum_c (TP_c + FN_c)}\]

<ul>
  <li><strong>Range:</strong> [0, 1].</li>
  <li><strong>When to use:</strong> When you want an <strong>overall performance measure</strong> that is dominated by the majority class. Micro-precision = micro-recall = accuracy in multi-class settings.</li>
</ul>

<hr />

<h3 id="weighted-averaged-precision--recall--f1">Weighted-Averaged Precision / Recall / F1</h3>

<ul>
  <li><strong>Definition:</strong> Per-class metric weighted by class support (count).</li>
</ul>

\[\text{Weighted-}F_1 = \sum_{c=1}^{C} \frac{n_c}{N} \cdot F_{1,c}\]

<ul>
  <li><strong>Range:</strong> [0, 1].</li>
  <li><strong>When to use:</strong> When classes are imbalanced and you want a single number that <strong>accounts for prevalence</strong>.</li>
</ul>

<hr />

<h3 id="confusion-matrix">Confusion Matrix</h3>

<ul>
  <li><strong>Definition:</strong> A C×C matrix where entry (i,j) counts samples with true class i predicted as class j.</li>
</ul>

\[M[i][j] = \text{count}(\text{true} = i,\ \text{predicted} = j)\]

<ul>
  <li><strong>When to use:</strong> <strong>Always inspect this first.</strong> Reveals the full error pattern — which classes are confused with which. Foundation for all other classification metrics.</li>
</ul>

<hr />

<h3 id="g-mean-geometric-mean">G-Mean (Geometric Mean)</h3>

<ul>
  <li><strong>Definition:</strong> Geometric mean of sensitivity and specificity.</li>
</ul>

\[G\text{-Mean} = \sqrt{\text{Sensitivity} \times \text{Specificity}}\]

<ul>
  <li><strong>Range:</strong> [0, 1].</li>
  <li><strong>When to use:</strong> Imbalanced classification where you want both classes predicted well. Zero if either class has zero recall.</li>
</ul>

<hr />

<h3 id="multi-class-auc-ovr--ovo">Multi-Class AUC (OvR / OvO)</h3>

<ul>
  <li><strong>Definition:</strong> Extension of binary AUC-ROC to multi-class.</li>
</ul>

\[AUC_{OvR} = \frac{1}{C} \sum_{c=1}^{C} AUC_c, \qquad AUC_{OvO} = \frac{2}{C(C-1)} \sum_{i&lt;j} AUC_{(i,j)}\]

<ul>
  <li><strong>Range:</strong> [0, 1].</li>
  <li><strong>When to use:</strong> Multi-class ranking evaluation. OvR is simpler; OvO is more fine-grained for models that produce pairwise scores.</li>
</ul>

<hr />

<h2 id="11-calibration-metrics">11. Calibration Metrics</h2>

<h3 id="expected-calibration-error-ece">Expected Calibration Error (ECE)</h3>

<ul>
  <li><strong>Definition:</strong> Weighted average of the absolute gap between predicted probability and observed frequency across bins.</li>
</ul>

\[ECE = \sum_{b=1}^{B} \frac{n_b}{N} \left| \text{acc}_b - \text{conf}_b \right|\]

<ul>
  <li><strong>Range:</strong> [0, 1]. Lower = better calibrated.</li>
  <li><strong>When to use:</strong> When predicted probabilities are used for <strong>downstream decisions</strong> (resource allocation, risk scoring). A model can have high AUC but poor calibration. Common choice: 10–15 equal-width bins.</li>
</ul>

<hr />

<h3 id="maximum-calibration-error-mce">Maximum Calibration Error (MCE)</h3>

<ul>
  <li><strong>Definition:</strong> The worst-case calibration gap across all bins.</li>
</ul>

\[MCE = \max_b \left| \text{acc}_b - \text{conf}_b \right|\]

<ul>
  <li><strong>Range:</strong> [0, 1].</li>
  <li><strong>When to use:</strong> Safety-critical applications where even <strong>one poorly calibrated probability region</strong> is unacceptable.</li>
</ul>

<hr />

<h3 id="calibration-curve-reliability-diagram">Calibration Curve (Reliability Diagram)</h3>

<ul>
  <li><strong>Definition:</strong> Visual diagnostic plotting mean predicted probability vs observed fraction of positives per bin.</li>
  <li><strong>When to use:</strong> Always plot alongside ECE. A perfectly calibrated model lies on the y = x diagonal. Reveals whether the model is over-confident (below diagonal) or under-confident (above).</li>
</ul>

<hr />

<h2 id="12-regression-metrics">12. Regression Metrics</h2>

<h3 id="mean-absolute-error-mae">Mean Absolute Error (MAE)</h3>

<ul>
  <li><strong>Definition:</strong> Average of absolute differences between predictions and actual values.</li>
</ul>

\[MAE = \frac{1}{N} \sum_{i=1}^{N} |y_i - \hat{y}_i|\]

<ul>
  <li><strong>Range:</strong> [0, +∞). Lower is better. Same units as target.</li>
  <li><strong>When to use:</strong> Default regression metric when you want <strong>robustness to outliers</strong> and equal treatment of all errors. More interpretable than MSE.</li>
</ul>

<hr />

<h3 id="mean-squared-error-mse">Mean Squared Error (MSE)</h3>

<ul>
  <li><strong>Definition:</strong> Average of squared differences between predictions and actuals.</li>
</ul>

\[MSE = \frac{1}{N} \sum_{i=1}^{N} (y_i - \hat{y}_i)^2\]

<ul>
  <li><strong>Range:</strong> [0, +∞). Units are squared.</li>
  <li><strong>When to use:</strong> When <strong>large errors are disproportionately bad</strong> and you want to penalise them. Differentiable, standard for optimisation.</li>
</ul>

<hr />

<h3 id="root-mean-squared-error-rmse">Root Mean Squared Error (RMSE)</h3>

<ul>
  <li><strong>Definition:</strong> Square root of MSE.</li>
</ul>

\[RMSE = \sqrt{\frac{1}{N} \sum_{i=1}^{N} (y_i - \hat{y}_i)^2}\]

<ul>
  <li><strong>Range:</strong> [0, +∞). Same units as target.</li>
  <li><strong>When to use:</strong> When you want MSE’s outlier sensitivity but in <strong>interpretable units</strong>. The most commonly reported regression metric.</li>
</ul>

<hr />

<h3 id="mean-absolute-percentage-error-mape">Mean Absolute Percentage Error (MAPE)</h3>

<ul>
  <li><strong>Definition:</strong> Average of absolute percentage errors.</li>
</ul>

\[MAPE = \frac{100}{N} \sum_{i=1}^{N} \left| \frac{y_i - \hat{y}_i}{y_i} \right|\]

<ul>
  <li><strong>Range:</strong> [0, +∞)%.</li>
  <li><strong>When to use:</strong> When you want errors as <strong>relative percentages</strong> for easy communication. <strong>Avoid</strong> when actual values can be zero or near-zero.</li>
</ul>

<hr />

<h3 id="symmetric-mape-smape">Symmetric MAPE (sMAPE)</h3>

<ul>
  <li><strong>Definition:</strong> A modified MAPE that treats over- and under-predictions more symmetrically.</li>
</ul>

\[sMAPE = \frac{100}{N} \sum_{i=1}^{N} \frac{2|y_i - \hat{y}_i|}{|y_i| + |\hat{y}_i|}\]

<ul>
  <li><strong>Range:</strong> [0, 200]%.</li>
  <li><strong>When to use:</strong> Alternative to MAPE that partially addresses its asymmetry. Still problematic when both actual and predicted are near zero.</li>
</ul>

<hr />

<h3 id="r-coefficient-of-determination">R² (Coefficient of Determination)</h3>

<ul>
  <li><strong>Definition:</strong> Proportion of variance in the target explained by the model.</li>
</ul>

\[R^2 = 1 - \frac{SS_{res}}{SS_{tot}} = 1 - \frac{\sum (y_i - \hat{y}_i)^2}{\sum (y_i - \bar{y})^2}\]

<ul>
  <li><strong>Range:</strong> (−∞, 1]. 1 = perfect. Can be negative.</li>
  <li><strong>When to use:</strong> Standard for reporting OLS regression fit. <strong>Negative R² means worse than predicting the mean.</strong> Always report for regression models but do not use as the sole criterion.</li>
</ul>

<hr />

<h3 id="adjusted-r">Adjusted R²</h3>

<ul>
  <li><strong>Definition:</strong> R² penalised for the number of predictors.</li>
</ul>

\[R^2_{adj} = 1 - (1 - R^2) \cdot \frac{N - 1}{N - p - 1}\]

<ul>
  <li><strong>Range:</strong> (−∞, 1]. p = number of predictors.</li>
  <li><strong>When to use:</strong> Comparing models with <strong>different numbers of predictors</strong>. Prevents selecting overfit models that add noise variables.</li>
</ul>

<hr />

<h3 id="median-absolute-error-medae">Median Absolute Error (MedAE)</h3>

<ul>
  <li><strong>Definition:</strong> Median of absolute differences between predictions and actuals.</li>
</ul>

\[\text{MedAE} = \text{median}\left(|y_i - \hat{y}_i|\right)\]

<ul>
  <li><strong>Range:</strong> [0, +∞).</li>
  <li><strong>When to use:</strong> When you want the <strong>typical error</strong>, uninfluenced by extreme outliers. More robust than both MAE and RMSE.</li>
</ul>

<hr />

<h3 id="max-error">Max Error</h3>

<ul>
  <li><strong>Definition:</strong> The largest absolute error across all predictions.</li>
</ul>

\[\text{MaxError} = \max_i |y_i - \hat{y}_i|\]

<ul>
  <li><strong>Range:</strong> [0, +∞).</li>
  <li><strong>When to use:</strong> <strong>Worst-case analysis</strong> — critical when you need to bound the maximum possible prediction error.</li>
</ul>

<hr />

<h3 id="explained-variance-score">Explained Variance Score</h3>

<ul>
  <li><strong>Definition:</strong> Proportion of target variance captured, allowing biased predictions.</li>
</ul>

\[EVS = 1 - \frac{\text{Var}(y - \hat{y})}{\text{Var}(y)}\]

<ul>
  <li><strong>Range:</strong> (−∞, 1].</li>
  <li><strong>When to use:</strong> Differs from R² only when predictions are biased (mean(y − ŷ) ≠ 0). Use alongside R² to diagnose systematic bias.</li>
</ul>

<hr />

<h3 id="huber-loss">Huber Loss</h3>

<ul>
  <li><strong>Definition:</strong> Loss function that is quadratic for small errors and linear for large ones.</li>
</ul>

\[L_\delta(a) = \begin{cases} \frac{1}{2}a^2 &amp; \text{if } |a| \leq \delta \\ \delta\left(|a| - \frac{1}{2}\delta\right) &amp; \text{otherwise} \end{cases}\]

<ul>
  <li><strong>Range:</strong> [0, +∞).</li>
  <li><strong>When to use:</strong> Training regression models when data has <strong>outliers</strong> but you still want some sensitivity to large errors. Combines benefits of MSE and MAE.</li>
</ul>

<hr />

<h3 id="quantile-loss-pinball-loss">Quantile Loss (Pinball Loss)</h3>

<ul>
  <li><strong>Definition:</strong> Asymmetric loss for quantile regression.</li>
</ul>

\[L_\tau(y, \hat{y}) = \tau \cdot \max(y - \hat{y},\, 0) + (1 - \tau) \cdot \max(\hat{y} - y,\, 0)\]

<ul>
  <li><strong>Range:</strong> [0, +∞).</li>
  <li><strong>When to use:</strong> When you want to predict a <strong>specific quantile</strong> rather than the mean — e.g. “the 90th percentile of travel time” or “the worst-case delay”. τ = 0.5 recovers MAE.</li>
</ul>

<hr />

<h2 id="13-ranking--retrieval-metrics">13. Ranking &amp; Retrieval Metrics</h2>

<h3 id="precisionk">Precision@k</h3>

<ul>
  <li><strong>Definition:</strong> Fraction of the top-k predictions that are relevant.</li>
</ul>

\[P@k = \frac{|\text{relevant items in top } k|}{k}\]

<ul>
  <li><strong>Range:</strong> [0, 1].</li>
  <li><strong>When to use:</strong> Evaluating <strong>top-k recommendation systems</strong> or prioritised risk lists (e.g. “of the 10 road segments we flagged, how many are genuinely high-risk?”).</li>
</ul>

<hr />

<h3 id="recallk">Recall@k</h3>

<ul>
  <li><strong>Definition:</strong> Fraction of all relevant items appearing in the top-k.</li>
</ul>

\[R@k = \frac{|\text{relevant items in top } k|}{|\text{total relevant}|}\]

<ul>
  <li><strong>Range:</strong> [0, 1].</li>
  <li><strong>When to use:</strong> When you need to know <strong>what proportion of true positives</strong> are captured in the top-k.</li>
</ul>

<hr />

<h3 id="map-mean-average-precision">MAP (Mean Average Precision)</h3>

<ul>
  <li><strong>Definition:</strong> Mean of average precision across all queries.</li>
</ul>

\[MAP = \frac{1}{Q} \sum_{q=1}^{Q} AP_q\]

<ul>
  <li><strong>Range:</strong> [0, 1].</li>
  <li><strong>When to use:</strong> Standard metric for information retrieval and ranked recommendation evaluation.</li>
</ul>

<hr />

<h3 id="ndcg-normalised-discounted-cumulative-gain">NDCG (Normalised Discounted Cumulative Gain)</h3>

<ul>
  <li><strong>Definition:</strong> Evaluates ranking quality using graded relevance, discounting items further down the list.</li>
</ul>

\[DCG@k = \sum_{i=1}^{k} \frac{2^{rel_i} - 1}{\log_2(i+1)}, \qquad NDCG@k = \frac{DCG@k}{IDCG@k}\]

<ul>
  <li><strong>Range:</strong> [0, 1].</li>
  <li><strong>When to use:</strong> When relevance is <strong>graded</strong> (not binary) and the <strong>position</strong> of relevant items matters. Top results should be more relevant.</li>
</ul>

<hr />

<h3 id="mrr-mean-reciprocal-rank">MRR (Mean Reciprocal Rank)</h3>

<ul>
  <li><strong>Definition:</strong> Average of the reciprocal rank of the first relevant result across queries.</li>
</ul>

\[MRR = \frac{1}{Q} \sum_{q=1}^{Q} \frac{1}{\text{rank}_q}\]

<ul>
  <li><strong>Range:</strong> [0, 1].</li>
  <li><strong>When to use:</strong> When you only care about the <strong>first correct result</strong> — e.g. search engines, QA systems.</li>
</ul>

<hr />

<h3 id="lift">Lift</h3>

<ul>
  <li><strong>Definition:</strong> Ratio of the model’s positive rate in a selected group compared to the overall rate.</li>
</ul>

\[\text{Lift} = \frac{\text{positive rate in selected group}}{\text{overall positive rate}}\]

<ul>
  <li><strong>Range:</strong> [0, +∞). Lift &gt; 1 = better than random.</li>
  <li><strong>When to use:</strong> Marketing, credit risk, targeted interventions. “How much better than random is our targeting?”</li>
</ul>

<hr />

<h2 id="14-clustering--external-with-ground-truth">14. Clustering — External (with Ground Truth)</h2>

<h3 id="adjusted-rand-index-ari">Adjusted Rand Index (ARI)</h3>

<ul>
  <li><strong>Definition:</strong> Pairwise agreement between predicted clustering and true labels, adjusted for chance.</li>
</ul>

\[ARI = \frac{RI - E[RI]}{\max(RI) - E[RI]}\]

<ul>
  <li><strong>Range:</strong> [−1, 1]. 1 = perfect, 0 = random agreement.</li>
  <li><strong>When to use:</strong> When you have <strong>true cluster labels</strong> and want a chance-corrected measure. Preferred over raw Rand Index.</li>
</ul>

<hr />

<h3 id="normalised-mutual-information-nmi">Normalised Mutual Information (NMI)</h3>

<ul>
  <li><strong>Definition:</strong> Mutual information between clustering and ground truth, normalised to [0,1].</li>
</ul>

\[NMI = \frac{2 \cdot I(U; V)}{H(U) + H(V)}\]

<ul>
  <li><strong>Range:</strong> [0, 1].</li>
  <li><strong>When to use:</strong> Comparing clusterings with <strong>different numbers of clusters</strong>. Information-theoretic and handles varying K well.</li>
</ul>

<hr />

<h3 id="homogeneity">Homogeneity</h3>

<ul>
  <li><strong>Definition:</strong> Each cluster contains only members of a single class.</li>
</ul>

\[h = 1 - \frac{H(C|K)}{H(C)}\]

<ul>
  <li><strong>Range:</strong> [0, 1].</li>
  <li><strong>When to use:</strong> When <strong>cluster purity</strong> matters most. Satisfied trivially by assigning each point to its own cluster.</li>
</ul>

<hr />

<h3 id="completeness">Completeness</h3>

<ul>
  <li><strong>Definition:</strong> All members of a given class are assigned to the same cluster.</li>
</ul>

\[c = 1 - \frac{H(K|C)}{H(K)}\]

<ul>
  <li><strong>Range:</strong> [0, 1].</li>
  <li><strong>When to use:</strong> When you want to ensure that entire classes are <strong>captured within single clusters</strong>.</li>
</ul>

<hr />

<h3 id="v-measure">V-Measure</h3>

<ul>
  <li><strong>Definition:</strong> Harmonic mean of homogeneity and completeness.</li>
</ul>

\[V = \frac{2hc}{h + c}\]

<ul>
  <li><strong>Range:</strong> [0, 1].</li>
  <li><strong>When to use:</strong> Balanced evaluation of clustering that rewards both purity and completeness. Analogous to F1 for clustering.</li>
</ul>

<hr />

<h3 id="fowlkes-mallows-index-fmi">Fowlkes-Mallows Index (FMI)</h3>

<ul>
  <li><strong>Definition:</strong> Geometric mean of pairwise precision and pairwise recall.</li>
</ul>

\[FMI = \sqrt{PPV_{\text{pairs}} \times TPR_{\text{pairs}}}\]

<ul>
  <li><strong>Range:</strong> [0, 1].</li>
  <li><strong>When to use:</strong> Alternative to ARI that is more interpretable as a precision-recall analogue for pairs.</li>
</ul>

<hr />

<h2 id="15-clustering--internal-no-ground-truth">15. Clustering — Internal (No Ground Truth)</h2>

<h3 id="silhouette-score">Silhouette Score</h3>

<ul>
  <li><strong>Definition:</strong> How similar a point is to its own cluster vs the nearest neighbouring cluster.</li>
</ul>

\[s(i) = \frac{b(i) - a(i)}{\max(a(i),\, b(i))}, \qquad \text{Overall} = \frac{1}{N}\sum_{i=1}^{N} s(i)\]

<ul>
  <li><strong>Range:</strong> [−1, 1]. Higher = better. Negative = likely misclassified.</li>
  <li><strong>When to use:</strong> General-purpose internal validation for <strong>convex clusters</strong>. Easy to interpret. Less suitable for density-based or non-convex clusters.</li>
</ul>

<hr />

<h3 id="davies-bouldin-index">Davies-Bouldin Index</h3>

<ul>
  <li><strong>Definition:</strong> Average similarity ratio of each cluster with its most similar cluster.</li>
</ul>

\[DB = \frac{1}{K} \sum_{i=1}^{K} \max_{j \neq i} \frac{s_i + s_j}{d(c_i, c_j)}\]

<ul>
  <li><strong>Range:</strong> [0, +∞). Lower = better.</li>
  <li><strong>When to use:</strong> Comparing different values of K. Does not require computing pairwise distances for all points, so <strong>more efficient</strong> than silhouette for large datasets.</li>
</ul>

<hr />

<h3 id="calinski-harabasz-index-variance-ratio-criterion">Calinski-Harabasz Index (Variance Ratio Criterion)</h3>

<ul>
  <li><strong>Definition:</strong> Ratio of between-cluster to within-cluster dispersion.</li>
</ul>

\[CH = \frac{B / (K - 1)}{W / (N - K)}\]

<ul>
  <li><strong>Range:</strong> [0, +∞). Higher = better.</li>
  <li><strong>When to use:</strong> Fast to compute. Favours <strong>compact, well-separated globular clusters</strong>. Best for k-means-like methods.</li>
</ul>

<hr />

<h3 id="inertia-within-cluster-sse">Inertia (Within-Cluster SSE)</h3>

<ul>
  <li><strong>Definition:</strong> Sum of squared distances from each point to its cluster centroid.</li>
</ul>

\[\text{Inertia} = \sum_{k=1}^{K} \sum_{x \in C_k} \|x - \mu_k\|^2\]

<ul>
  <li><strong>Range:</strong> [0, +∞). Lower = better.</li>
  <li><strong>When to use:</strong> Used in the <strong>elbow method</strong> for choosing K. Always decreases with more clusters — look for the “elbow” where marginal improvement diminishes.</li>
</ul>

<hr />

<h3 id="dbcv-density-based-cluster-validation">DBCV (Density-Based Cluster Validation)</h3>

<ul>
  <li><strong>Definition:</strong> Validity index for density-based clusters using mutual reachability distances.</li>
</ul>

\[DBCV = \frac{1}{K} \sum_{c=1}^{K} V(c), \qquad V(c) = \frac{DSC(c) - DSPC(c)}{\max(DSC(c),\, DSPC(c))}\]

<ul>
  <li><strong>Range:</strong> [−1, 1].</li>
  <li><strong>When to use:</strong> Evaluating <strong>DBSCAN or HDBSCAN</strong> clusters with arbitrary shapes. Unlike silhouette, does not assume convex clusters.</li>
</ul>

<hr />

<h2 id="16-model-selection--validation">16. Model Selection &amp; Validation</h2>

<h3 id="k-fold-cross-validation-score">k-Fold Cross-Validation Score</h3>

<ul>
  <li><strong>Definition:</strong> Data is split into k folds; model trains on k−1, tests on the held-out fold, repeated k times.</li>
</ul>

\[CV = \frac{1}{k} \sum_{i=1}^{k} \text{Score}(\text{fold}_i)\]

<ul>
  <li><strong>When to use:</strong> <strong>Standard evaluation protocol</strong> to estimate generalisation performance and diagnose overfitting. Typical k = 5 or 10. Use stratified k-fold for imbalanced classification. Report both mean and standard deviation.</li>
</ul>

<hr />

<h3 id="leave-one-out-cross-validation-loocv">Leave-One-Out Cross-Validation (LOOCV)</h3>

<ul>
  <li><strong>Definition:</strong> Special case of k-fold where k = N.</li>
</ul>

\[LOOCV = \frac{1}{N} \sum_{i=1}^{N} L\left(y_i,\, f_{-i}(x_i)\right)\]

<ul>
  <li><strong>When to use:</strong> Very small datasets where losing even a few samples to a test fold is costly. Unbiased but high-variance and computationally expensive.</li>
</ul>

<hr />

<h3 id="bias-variance-decomposition">Bias-Variance Decomposition</h3>

<ul>
  <li><strong>Definition:</strong> Decomposes expected prediction error into irreducible noise + bias² + variance.</li>
</ul>

\[E\left[(y - \hat{f}(x))^2\right] = \sigma^2 + \text{Bias}^2(\hat{f}) + \text{Var}(\hat{f})\]

<ul>
  <li><strong>When to use:</strong> <strong>Conceptual framework</strong> for diagnosing whether a model underfits (high bias) or overfits (high variance). Not directly computed, but diagnosed via learning curves.</li>
</ul>

<hr />

<h3 id="learning-curve">Learning Curve</h3>

<ul>
  <li><strong>Definition:</strong> Plots training and validation performance as a function of training set size.</li>
  <li><strong>When to use:</strong> Diagnosing <strong>bias-variance trade-off</strong> visually. Converging low scores = underfit; diverging scores = overfit; converging high scores = good fit.</li>
</ul>

<hr />

<h2 id="17-feature-importance--interpretability">17. Feature Importance &amp; Interpretability</h2>

<h3 id="gini-importance-mean-decrease-in-impurity">Gini Importance (Mean Decrease in Impurity)</h3>

<ul>
  <li><strong>Definition:</strong> Total reduction in impurity attributed to a feature across all tree splits.</li>
</ul>

\[\text{Imp}(f) = \sum_{\text{nodes splitting on } f} \frac{n_{\text{node}}}{N} \cdot \Delta(\text{impurity})\]

<ul>
  <li><strong>Range:</strong> [0, 1] when normalised.</li>
  <li><strong>When to use:</strong> Quick feature ranking for <strong>tree-based models</strong> (Random Forest, Gradient Boosting). Biased towards high-cardinality and correlated features — use permutation importance for more reliable results.</li>
</ul>

<hr />

<h3 id="permutation-importance">Permutation Importance</h3>

<ul>
  <li><strong>Definition:</strong> Drop in model performance when a feature’s values are randomly shuffled.</li>
</ul>

\[PI(f) = \text{Score}_{\text{original}} - \frac{1}{K}\sum_{k=1}^{K} \text{Score}_{\text{permuted},k}\]

<ul>
  <li><strong>Range:</strong> Can be negative (feature hurts model).</li>
  <li><strong>When to use:</strong> <strong>Model-agnostic</strong> feature importance. Compute on the validation set. More reliable than Gini importance for correlated features.</li>
</ul>

<hr />

<h3 id="shap-values-shapley-additive-explanations">SHAP Values (SHapley Additive exPlanations)</h3>

<ul>
  <li><strong>Definition:</strong> Game-theoretic attribution of each feature’s contribution to each individual prediction.</li>
</ul>

\[\phi_j = \sum_{S \subseteq F \setminus \{j\}} \frac{|S|!\,(p - |S| - 1)!}{p!} \left[ f(S \cup \{j\}) - f(S) \right]\]

<ul>
  <li><strong>Range:</strong> (−∞, +∞). Sum of all φⱼ = f(x) − E[f(x)].</li>
  <li><strong>When to use:</strong> When you need <strong>instance-level</strong> explanation — why did the model make this specific prediction? Satisfies desirable theoretical properties (local accuracy, missingness, consistency). Computationally expensive.</li>
</ul>

<hr />

<h3 id="variance-inflation-factor-vif">Variance Inflation Factor (VIF)</h3>

<ul>
  <li><strong>Definition:</strong> Measures multicollinearity for predictor j.</li>
</ul>

\[VIF_j = \frac{1}{1 - R_j^2}\]

<ul>
  <li><strong>Range:</strong> [1, +∞). VIF &gt; 5–10 = problematic.</li>
  <li><strong>When to use:</strong> <strong>Before fitting regression models</strong> to detect and remove highly correlated predictors. High VIF inflates standard errors and destabilises coefficients.</li>
</ul>

<hr />

<h2 id="18-distance--similarity-metrics">18. Distance &amp; Similarity Metrics</h2>

<h3 id="euclidean-distance-l2">Euclidean Distance (L2)</h3>

<ul>
  <li><strong>Definition:</strong> Straight-line distance in n-dimensional space.</li>
</ul>

\[d(\mathbf{x}, \mathbf{y}) = \sqrt{\sum_{i=1}^{n} (x_i - y_i)^2}\]

<ul>
  <li><strong>Range:</strong> [0, +∞).</li>
  <li><strong>When to use:</strong> Default distance for k-means, kNN, and most geometric methods. Assumes all features are on <strong>comparable scales</strong> — standardise first if not.</li>
</ul>

<hr />

<h3 id="manhattan-distance-l1">Manhattan Distance (L1)</h3>

<ul>
  <li><strong>Definition:</strong> Sum of absolute differences along each dimension.</li>
</ul>

\[d(\mathbf{x}, \mathbf{y}) = \sum_{i=1}^{n} |x_i - y_i|\]

<ul>
  <li><strong>Range:</strong> [0, +∞).</li>
  <li><strong>When to use:</strong> Grid-based environments, high-dimensional data (less affected by curse of dimensionality than Euclidean), or when features are on <strong>different scales</strong> and not standardised.</li>
</ul>

<hr />

<h3 id="cosine-similarity">Cosine Similarity</h3>

<ul>
  <li><strong>Definition:</strong> Cosine of the angle between two vectors.</li>
</ul>

\[\cos(\mathbf{x}, \mathbf{y}) = \frac{\mathbf{x} \cdot \mathbf{y}}{\|\mathbf{x}\| \cdot \|\mathbf{y}\|}\]

<ul>
  <li><strong>Range:</strong> [−1, 1]. 1 = identical direction.</li>
  <li><strong>When to use:</strong> Text analysis (TF-IDF, embeddings), recommendation systems — anywhere <strong>direction matters more than magnitude</strong>.</li>
</ul>

<hr />

<h3 id="jaccard-index-iou">Jaccard Index (IoU)</h3>

<ul>
  <li><strong>Definition:</strong> Intersection over union of two sets.</li>
</ul>

\[J(A, B) = \frac{|A \cap B|}{|A \cup B|}\]

<ul>
  <li><strong>Range:</strong> [0, 1].</li>
  <li><strong>When to use:</strong> Comparing <strong>sets or binary vectors</strong> — e.g. object detection bounding boxes (IoU), set similarity, binary feature overlap.</li>
</ul>

<hr />

<h3 id="mahalanobis-distance">Mahalanobis Distance</h3>

<ul>
  <li><strong>Definition:</strong> Scale-invariant distance accounting for correlations via the covariance matrix.</li>
</ul>

\[d(\mathbf{x}, \mathbf{y}) = \sqrt{(\mathbf{x} - \mathbf{y})^T \mathbf{S}^{-1} (\mathbf{x} - \mathbf{y})}\]

<ul>
  <li><strong>Range:</strong> [0, +∞). S = covariance matrix.</li>
  <li><strong>When to use:</strong> <strong>Outlier detection</strong>, classification with correlated features. Reduces to Euclidean when S = I. Accounts for the shape of the data distribution.</li>
</ul>

<hr />

<h3 id="hamming-distance">Hamming Distance</h3>

<ul>
  <li><strong>Definition:</strong> Number of positions where corresponding elements differ.</li>
</ul>

\[d(\mathbf{x}, \mathbf{y}) = \sum_{i=1}^{n} \mathbf{1}(x_i \neq y_i)\]

<ul>
  <li><strong>Range:</strong> [0, n].</li>
  <li><strong>When to use:</strong> <strong>Categorical or binary data</strong> — e.g. comparing one-hot encoded features, DNA sequences, error-correcting codes.</li>
</ul>

<hr />

<h3 id="minkowski-distance-lp">Minkowski Distance (Lp)</h3>

<ul>
  <li><strong>Definition:</strong> Generalised distance metric parameterised by p.</li>
</ul>

\[d(\mathbf{x}, \mathbf{y}) = \left(\sum_{i=1}^{n} |x_i - y_i|^p\right)^{1/p}\]

<ul>
  <li><strong>Range:</strong> [0, +∞). p=1 → Manhattan, p=2 → Euclidean, p→∞ → Chebyshev.</li>
  <li><strong>When to use:</strong> When you want to <strong>tune the distance sensitivity</strong> between Manhattan and Euclidean behaviour.</li>
</ul>

<hr />

<h2 id="appendix-common-notation">Appendix: Common Notation</h2>

<table>
  <thead>
    <tr>
      <th>Symbol</th>
      <th>Meaning</th>
    </tr>
  </thead>
  <tbody>
    <tr>
      <td>$TP, TN, FP, FN$</td>
      <td>True Positives, True Negatives, False Positives, False Negatives</td>
    </tr>
    <tr>
      <td>$N$</td>
      <td>Total number of samples</td>
    </tr>
    <tr>
      <td>$C$</td>
      <td>Number of classes</td>
    </tr>
    <tr>
      <td>$K$</td>
      <td>Number of clusters</td>
    </tr>
    <tr>
      <td>$y_i$</td>
      <td>Actual (true) value for sample i</td>
    </tr>
    <tr>
      <td>$\hat{y}_i$ (or $\mu_i$)</td>
      <td>Predicted value for sample i</td>
    </tr>
    <tr>
      <td>$\bar{y}$</td>
      <td>Mean of actual values</td>
    </tr>
    <tr>
      <td>$p_i$</td>
      <td>Predicted probability for sample i</td>
    </tr>
    <tr>
      <td>$\ell(\theta)$</td>
      <td>Log-likelihood of parameters θ</td>
    </tr>
    <tr>
      <td>$k$ or $p$</td>
      <td>Number of model parameters / predictors</td>
    </tr>
    <tr>
      <td>$w_{ij}$</td>
      <td>Spatial weight between locations i and j</td>
    </tr>
    <tr>
      <td>$S_0$</td>
      <td>Sum of all spatial weights</td>
    </tr>
    <tr>
      <td>$H(X)$</td>
      <td>Entropy of variable X</td>
    </tr>
    <tr>
      <td>$I(X; Y)$</td>
      <td>Mutual information between X and Y</td>
    </tr>
    <tr>
      <td>$SS_{res},\ SS_{tot}$</td>
      <td>Residual and total sum of squares</td>
    </tr>
    <tr>
      <td>$SE$</td>
      <td>Standard error</td>
    </tr>
    <tr>
      <td>$df$</td>
      <td>Degrees of freedom</td>
    </tr>
    <tr>
      <td>$\alpha$</td>
      <td>Significance level (commonly 0.05)</td>
    </tr>
    <tr>
      <td>$\beta$</td>
      <td>Type II error rate; also F-beta parameter</td>
    </tr>
  </tbody>
</table>]]></content><author><name>Zhengpei(Pippin) Xu</name><email>zhengpei_xu@outlook.com</email><uri>https://zhengpei-xu.github.io</uri></author><category term="Statistical Model" /><category term="Machine Learning" /><summary type="html"><![CDATA[Table of Contents]]></summary></entry><entry><title type="html">Lost in the Streets: Comparing Community Detection Algorithms Across Three Cities</title><link href="https://zhengpei-xu.github.io/posts/2026/03/Comparing%20Community%20Detection%20Algorithms%20Across%20Three%20Cities/" rel="alternate" type="text/html" title="Lost in the Streets: Comparing Community Detection Algorithms Across Three Cities" /><published>2026-03-12T00:00:00+00:00</published><updated>2026-03-12T00:00:00+00:00</updated><id>https://zhengpei-xu.github.io/posts/2026/03/Comparing%20Community%20Detection%20Algorithms%20Across%20Three%20Cities</id><content type="html" xml:base="https://zhengpei-xu.github.io/posts/2026/03/Comparing%20Community%20Detection%20Algorithms%20Across%20Three%20Cities/"><![CDATA[<p>If you have ever walked through the City of London, navigated the perfectly tiled blocks of Barcelona’s Eixample, or gotten hopelessly lost in the narrow alleys of Venice, you already have an intuition that these cities feel fundamentally different. But what happens when you ask a computer algorithm to read them?</p>

<p>Community detection — the task of finding groups of densely connected nodes in a network — has become a popular tool in urban analysis. Applied to street networks, it promises to reveal something about how cities are naturally structured: which streets belong together, where one neighbourhood ends and another begins, and how urban form shapes movement and flow.</p>

<p>But here is the catch: there is no single definition of what a “community” is. Different algorithms ask fundamentally different questions of the same network. Run three algorithms on the same city and you will get three different answers. Run one algorithm on three different cities and the results will shift again.</p>

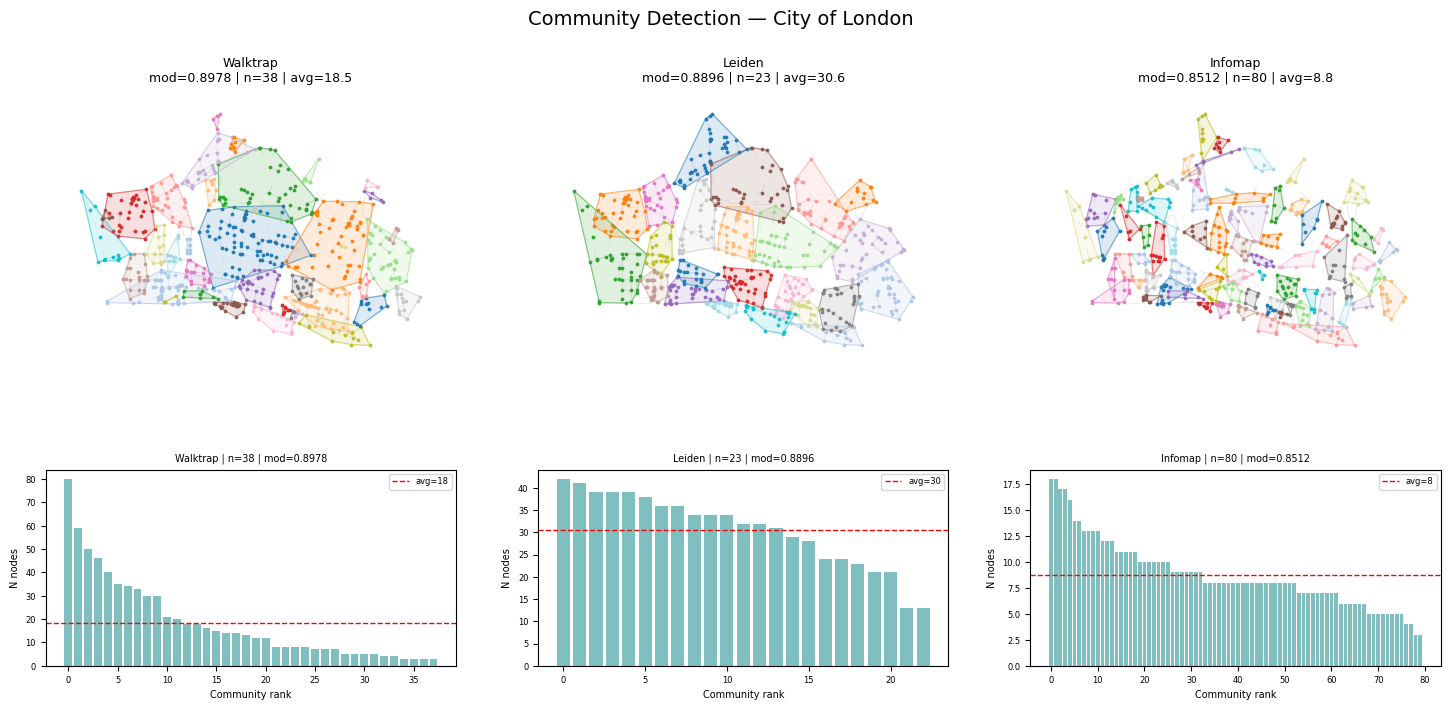
<p>This post does both. Using OSMnx to extract street networks from three cities — the City of London, the Eixample district of Barcelona, and the San Polo sestiere of Venice — and cdlib to run three community detection algorithms, I ask: does the algorithm see the city, or does the city shape the algorithm?</p>

<h2 id="three-cities-three-urban-archetypes">Three Cities, Three Urban Archetypes</h2>

<p>The three cities were chosen deliberately to represent three fundamentally different types of urban morphology.</p>

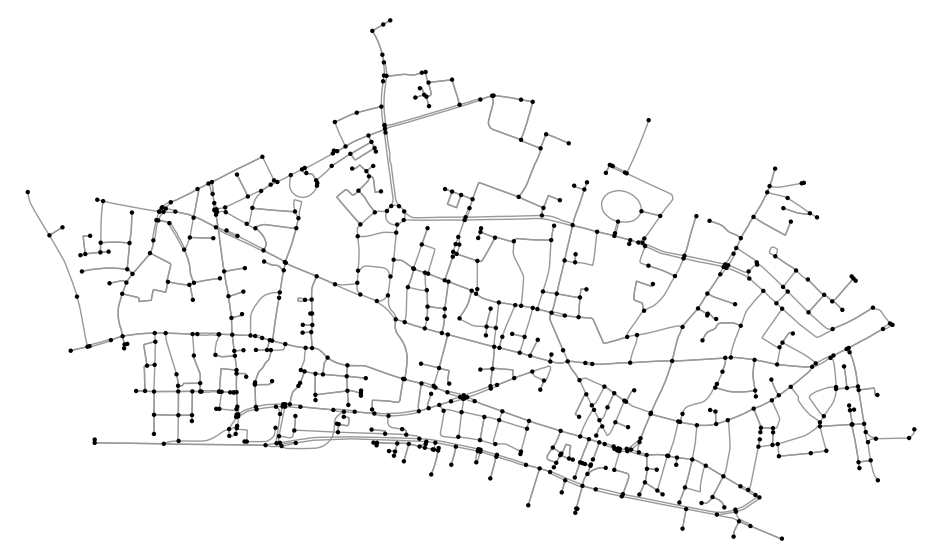
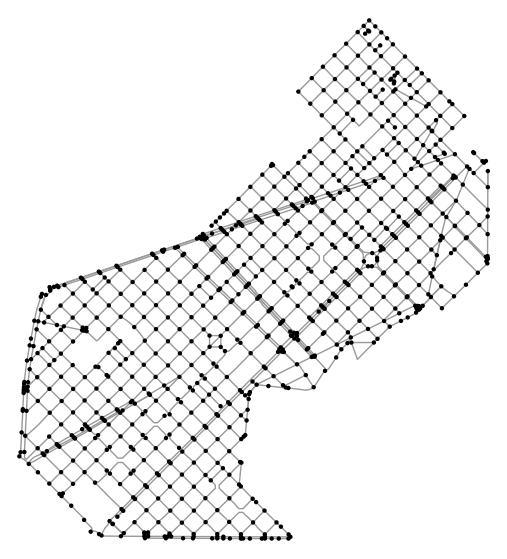
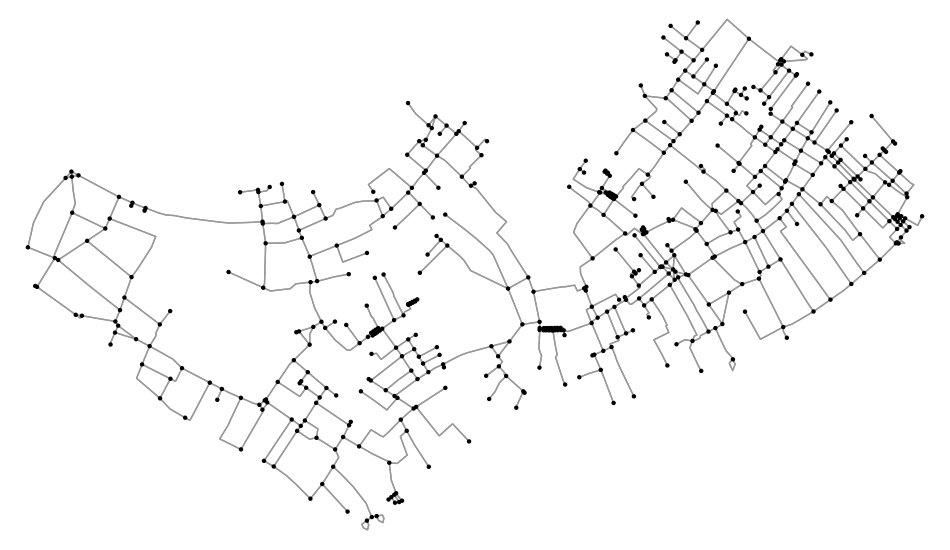
<figure data-latex-placement="H">
<img src="/assets/images/images-3streets/city_of_london_1.png" style="width:100.0%" />
<figcaption>Fig 1. Street network of the City of London — organic, irregular, and historically layered.</figcaption>
</figure>

<p><strong>The City of London</strong> is the result of organic, unplanned growth. Its street network reflects nearly two thousand years of incremental development — Roman foundations, medieval expansion, post-fire rebuilding, and Victorian additions layered on top of each other. The result is an irregular, asymmetric network with high variability in block size, street width, and connectivity. It has no dominant geometry.</p>

<figure data-latex-placement="H">
<img src="/assets/images/images-3streets/eixample_1.png" style="width:100.0%" />
<figcaption>Fig 2. Street network of Eixample, Barcelona — a near-perfect grid designed by Ildefons Cerdà in 1860.</figcaption>
</figure>

<p><strong>Eixample, Barcelona</strong> is the opposite extreme. Designed by Ildefons Cerdà in 1860, it is one of the most celebrated examples of rational urban planning in history. Its defining feature is a near-perfect grid of octagonal blocks, with chamfered corners at every intersection. Every block is roughly the same size. Every intersection looks roughly the same. It is a network of radical, deliberate uniformity.</p>

<figure data-latex-placement="H">
<img src="/assets/images/images-3streets/san_polo_1.png" style="width:100.0%" />
<figcaption>Fig 3. Street network of San Polo, Venice — constrained by water, shaped by bridges and narrow alleys.</figcaption>
</figure>

<p><strong>San Polo, Venice</strong> is constrained by something neither of the other two cities had to contend with: water. The street network of Venice’s historic centre is shaped entirely by the lagoon’s geography — canals replace roads, bridges create bottlenecks, and the result is a labyrinthine network of narrow pedestrian alleys (<em>calli</em>) punctuated by small squares (<em>campi</em>). It is fragmented by nature, not by plan.</p>

<p>These three cities were not chosen arbitrarily. They represent the three fundamental forces that shape urban street networks: <strong>organic growth</strong>, <strong>rational planning</strong>, and <strong>geographic constraint</strong>. If community detection algorithms are sensitive to urban morphology — and we should expect them to be — these three cities should produce meaningfully different results.</p>

<h2 id="three-algorithms-three-ways-of-seeing">Three Algorithms, Three Ways of Seeing</h2>

<p>Just as important as the choice of cities is the choice of algorithms. Community detection is not a single method but a family of approaches, each built on a different theoretical foundation and a different implicit definition of what makes a good community.</p>

<p>For this experiment, three algorithms were selected to cover three distinct paradigms.</p>

<p><strong>Walktrap</strong> (Pons &amp; Latapy, 2005) is built on the intuition of random walks. The core idea is simple: a random walker exploring a network will tend to get trapped within densely connected subgraphs, visiting the same nodes repeatedly before finding a bridge to another part of the network. Communities are identified by running many short random walks and clustering nodes that are frequently visited together. For street networks, this has a natural urban interpretation — it approximates the experience of someone wandering through a neighbourhood, more likely to loop around familiar streets than to cross into an entirely different area.</p>

<p><strong>Leiden</strong> (Traag, Waltman &amp; van Eck, 2019) takes a different approach, optimising a quantity called modularity — a measure of how much denser the connections within communities are compared to what you would expect from a random network with the same degree distribution. Leiden is an improvement over the earlier and widely-used Louvain algorithm, adding a critical refinement step that guarantees every detected community is internally connected. This matters for spatial networks: Louvain can produce communities that are topologically disconnected, which makes no sense in a geographic context. Leiden fixes this.</p>

<p><strong>Infomap</strong> (Rosvall &amp; Bergstrom, 2008) comes from information theory. Rather than maximising modularity, it minimises the description length of a random walk through the network — essentially asking: what partition of the network allows us to describe the path of a random walker most efficiently? Communities are places where information flow tends to circulate before escaping. Crucially, Infomap natively supports directed and weighted networks, making it the only algorithm in this set that can properly account for the directionality of one-way streets.</p>

<p>Together, these three algorithms ask three different questions of the same street network:</p>
<ul>
  <li>Walktrap asks: <em>where does a random walker get stuck?</em></li>
  <li>Leiden asks: <em>where are connections denser than chance would predict?</em></li>
  <li>Infomap asks: <em>where does information tend to circulate?</em></li>
</ul>

<p>These are not equivalent questions, and we should not expect equivalent answers.</p>

<p>A note on implementation: all three algorithms were run on undirected versions of the OSMnx street graphs, with edge weights set to the inverse of street length (so that shorter streets — implying stronger local connectivity — carry higher weight). Modularity, coverage, and performance were computed for each partition to enable cross-algorithm and cross-city comparison.</p>

<p>Not all community detection algorithms are created equal — and not all of them are suitable for street networks. Here is a quick reference of the main algorithms I considered before settling on the three used in this experiment.</p>

<table>
  <thead>
    <tr>
      <th>Algorithm</th>
      <th>Type</th>
      <th>Core Principle</th>
      <th>Directed</th>
      <th>Weighted</th>
      <th>Complexity</th>
      <th>Best Used When</th>
    </tr>
  </thead>
  <tbody>
    <tr>
      <td>Girvan-Newman</td>
      <td>Divisive hierarchical</td>
      <td>Iteratively removes edges with highest betweenness</td>
      <td>✓ (iGraph only)</td>
      <td>✓ (iGraph only)</td>
      <td>O(N³)</td>
      <td>Small networks, need precise community boundaries, research settings</td>
    </tr>
    <tr>
      <td>Clauset-Newman-Moore</td>
      <td>Agglomerative hierarchical</td>
      <td>Greedy merging to maximise modularity</td>
      <td>✗</td>
      <td>✓</td>
      <td>O(N log²N)</td>
      <td>Large undirected networks, fast exploratory analysis</td>
    </tr>
    <tr>
      <td>Walktrap</td>
      <td>Agglomerative hierarchical</td>
      <td>Short random walks tend to stay within the same community</td>
      <td>✗ (directed → undirected)</td>
      <td>✓</td>
      <td>O(N²log N)</td>
      <td>Street networks, uneven density networks</td>
    </tr>
    <tr>
      <td>Leading Eigenvector</td>
      <td>Spectral</td>
      <td>Computes eigenvector of modularity matrix for largest positive eigenvalue</td>
      <td>✗</td>
      <td>✗</td>
      <td>Moderate</td>
      <td>Undirected unweighted networks, theoretically rigorous settings</td>
    </tr>
    <tr>
      <td>Louvain</td>
      <td>Modularity optimisation</td>
      <td>Local modularity optimisation then super-node aggregation, iterative</td>
      <td>✗</td>
      <td>✓</td>
      <td>O(N)</td>
      <td>Large-scale networks, need fast results</td>
    </tr>
    <tr>
      <td>Leiden</td>
      <td>Modularity optimisation</td>
      <td>Louvain + refinement phase guaranteeing internal connectivity</td>
      <td>✗</td>
      <td>✓</td>
      <td>O(N log N)</td>
      <td>Need guaranteed connected communities, better alternative to Louvain</td>
    </tr>
    <tr>
      <td>Infomap</td>
      <td>Information theory</td>
      <td>Minimises description length of random walker trajectory</td>
      <td>✓</td>
      <td>✓</td>
      <td>O(N)</td>
      <td>Directed networks, flow data, need highest node classification accuracy</td>
    </tr>
  </tbody>
</table>

<h2 id="results">Results</h2>

<h3 id="metrics-summary">Metrics Summary</h3>

<table>
  <thead>
    <tr>
      <th>City</th>
      <th>Algorithm</th>
      <th>N Communities</th>
      <th>Modularity</th>
      <th>Coverage</th>
      <th>Performance</th>
    </tr>
  </thead>
  <tbody>
    <tr>
      <td>City of London</td>
      <td>Walktrap</td>
      <td>38</td>
      <td>0.8978</td>
      <td>0.9141</td>
      <td>0.9536</td>
    </tr>
    <tr>
      <td>City of London</td>
      <td>Leiden</td>
      <td>23</td>
      <td>0.8896</td>
      <td>0.9277</td>
      <td>0.9571</td>
    </tr>
    <tr>
      <td>City of London</td>
      <td>Infomap</td>
      <td>80</td>
      <td>0.8512</td>
      <td>0.8275</td>
      <td>0.9890</td>
    </tr>
    <tr>
      <td>Eixample, Barcelona</td>
      <td>Walktrap</td>
      <td>30</td>
      <td>0.8368</td>
      <td>0.8644</td>
      <td>0.9487</td>
    </tr>
    <tr>
      <td>Eixample, Barcelona</td>
      <td>Leiden</td>
      <td>16</td>
      <td>0.8507</td>
      <td>0.9035</td>
      <td>0.9386</td>
    </tr>
    <tr>
      <td>Eixample, Barcelona</td>
      <td>Infomap</td>
      <td>70</td>
      <td>0.7803</td>
      <td>0.7726</td>
      <td>0.9866</td>
    </tr>
    <tr>
      <td>San Polo, Venice</td>
      <td>Walktrap</td>
      <td>35</td>
      <td>0.8824</td>
      <td>0.9296</td>
      <td>0.9552</td>
    </tr>
    <tr>
      <td>San Polo, Venice</td>
      <td>Leiden</td>
      <td>21</td>
      <td>0.8719</td>
      <td>0.9411</td>
      <td>0.9530</td>
    </tr>
    <tr>
      <td>San Polo, Venice</td>
      <td>Infomap</td>
      <td>66</td>
      <td>0.8269</td>
      <td>0.8477</td>
      <td>0.9866</td>
    </tr>
  </tbody>
</table>

<blockquote>
  <p><strong>Modularity</strong> measures how much denser the connections within communities are compared to a random network. Scores above 0.7 are generally considered strong. It has a known limitation — the <strong>resolution limit</strong> — where optimisation tends to merge small but genuine communities into larger ones, which is one reason Leiden consistently produces fewer, larger communities than Walktrap.</p>

  <p><strong>Coverage</strong> measures the proportion of edges that fall <em>within</em> communities rather than <em>between</em> them. A high coverage score means the partition is capturing most of the network’s real internal connections, rather than cutting across them.</p>

  <p><strong>Performance</strong> measures the fraction of all possible node pairs that are correctly classified — nodes in the same community that are actually connected, and nodes in different communities that are genuinely not. Infomap consistently achieves ~0.99 across all three cities, which sounds impressive until you realise it does so by producing hundreds of tiny, statistically clean but geographically meaningless communities.</p>

  <p>The tension between these three metrics is itself one of the key findings of this experiment: a partition can score well on Performance while scoring poorly on Modularity. There is no single number that captures whether a community partition is <em>good</em> — it depends entirely on what you are trying to do with it.</p>
</blockquote>

<figure data-latex-placement="H">
<img src="/assets/images/images-3streets/city_of_london.png" style="width:100.0%" />
<figcaption>Fig 4. Community detection results for the City of London — Walktrap (left), Leiden (centre), Infomap (right). Top row: community map with convex hull shading. Bottom row: community size distribution.</figcaption>
</figure>

<figure data-latex-placement="H">
<img src="/assets/images/images-3streets/eixample.png" style="width:100.0%" />
<figcaption>Fig 5. Community detection results for Eixample, Barcelona. The regularity of the grid produces larger, less differentiated communities compared to the other two cities.</figcaption>
</figure>

<figure data-latex-placement="H">
<img src="/assets/images/images-3streets/san_polo.png" style="width:100.0%" />
<figcaption>Fig 6. Community detection results for San Polo, Venice. Bridges and canal bottlenecks create natural community boundaries, resulting in smaller and more fragmented partitions.</figcaption>
</figure>

<h3 id="finding-1-the-algorithm-ranking-is-stable-but-the-city-changes-everything">Finding 1: The algorithm ranking is stable, but the city changes everything</h3>

<p>The most striking result is how consistent the relative ranking of algorithms is across all three cities. In every case, Walktrap produces the highest modularity, Leiden produces the fewest and largest communities, and Infomap over-partitions while achieving near-perfect Performance (~0.99). The hierarchy does not change regardless of whether you are looking at medieval London, rational Barcelona, or labyrinthine Venice.</p>

<p>What does change is the absolute values and the community sizes. Eixample consistently produces the lowest modularity scores across all three algorithms — with Infomap dropping as low as 0.7803 — and the largest average community sizes under Leiden (avg=51.9 nodes per community, compared to 30.6 in London and 25.9 in Venice). The grid’s radical uniformity leaves the algorithm with very little structural signal to work with. When every intersection looks the same, there is less modularity to find.</p>

<p>San Polo produces the smallest communities overall, with Walktrap averaging just 15.5 nodes per community. This is consistent with what you would expect from Venice’s topology: the narrow alleys and frequent dead-ends create natural bottlenecks that the algorithms interpret as community boundaries, fragmenting the network into small, tight clusters.</p>

<h3 id="finding-2-high-performance-does-not-mean-urban-interpretability">Finding 2: High performance does not mean urban interpretability</h3>

<p>Infomap achieves the highest Performance score in every city and every comparison. On paper, this makes it the best algorithm. In practice, it is the least useful for urban analysis.</p>

<p>Performance measures how accurately node pairs are classified — whether two nodes in the same community are actually well-connected, and whether two nodes in different communities are genuinely separated. Infomap’s micro-communities score well on this metric precisely because they are so small: a community of 8 nodes is almost guaranteed to be internally dense. But a community of 8 nodes in a medieval city or a Venetian <em>campo</em> does not correspond to any recognisable urban unit. It is statistically rigorous and geographically meaningless.</p>

<p>This is a broader lesson that applies beyond this experiment. Optimising for a metric is not the same as finding something real. The choice of algorithm should follow the research question, not the other way around.</p>

<h3 id="finding-3-urban-morphology-is-legible-in-the-community-structure">Finding 3: Urban morphology is legible in the community structure</h3>

<p>Perhaps the most visually compelling result is how different the community maps look for each city, even under the same algorithm.</p>

<p>In the City of London, communities under Leiden are large, irregular polygons that roughly correspond to recognisable clusters of streets — the kind of organic groupings you might expect from a city that grew without a plan. The convex hulls are uneven and overlapping, reflecting the network’s complexity.</p>

<p>In Eixample, the communities are more regular in shape, reflecting the underlying grid. Leiden in particular produces very large communities that span multiple blocks, suggesting that the algorithm cannot find strong internal boundaries in a network designed to have none. The uniformity of the grid is the point — and it makes community detection harder.</p>

<p>In San Polo, the communities are small and scattered, disconnected from each other in ways that mirror the physical fragmentation of the island’s topology. The bridges and bottlenecks that define movement in Venice show up clearly as community boundaries.</p>

<h2 id="conclusion">Conclusion</h2>

<p>Running community detection on street networks is easy. Interpreting the results requires understanding both the algorithm and the city.</p>

<p>This experiment shows that the relative behaviour of algorithms is robust — Walktrap will always find more granular communities than Leiden, and Infomap will always over-partition — but the absolute results are shaped by urban morphology in ways that are both measurable and visually interpretable. A grid city like Eixample is harder to partition than an organic city like the City of London. A constrained network like Venice produces smaller, more fragmented communities than either.</p>

<p>The deeper lesson is about the relationship between method and meaning. No algorithm is universally better. Walktrap’s random walk intuition maps naturally onto pedestrian movement. Leiden’s connectivity guarantees make it appropriate for spatial analysis. Infomap’s direction-awareness makes it the right tool when one-way streets matter. The question is not which algorithm wins, but which question you are trying to answer.</p>

<p>The streets were there long before the algorithms. The algorithms just help us see them differently.</p>

<h2 id="references">References</h2>

<ul>
  <li>Pons, P. &amp; Latapy, M. (2005). Computing communities in large networks using random walks. <em>Computer and Information Sciences</em>.</li>
  <li>Traag, V.A., Waltman, L. &amp; van Eck, N.J. (2019). From Louvain to Leiden: guaranteeing well-connected communities. <em>Scientific Reports</em>, 9, 5233.</li>
  <li>Rosvall, M. &amp; Bergstrom, C.T. (2008). Maps of random walks on complex networks reveal community structure. <em>PNAS</em>, 105(4), 1118–1123.</li>
  <li>Boeing, G. (2017). OSMnx: New methods for acquiring, constructing, analyzing, and visualizing complex street networks. <em>Computers, Environment and Urban Planning</em>, 65, 126–139.</li>
  <li>Lancichinetti, A. &amp; Fortunato, S. (2009). Community detection algorithms: a comparative analysis. <em>Physical Review E</em>, 80, 016118.</li>
</ul>]]></content><author><name>Zhengpei(Pippin) Xu</name><email>zhengpei_xu@outlook.com</email><uri>https://zhengpei-xu.github.io</uri></author><category term="Street Networks" /><summary type="html"><![CDATA[If you have ever walked through the City of London, navigated the perfectly tiled blocks of Barcelona’s Eixample, or gotten hopelessly lost in the narrow alleys of Venice, you already have an intuition that these cities feel fundamentally different. But what happens when you ask a computer algorithm to read them?]]></summary></entry><entry><title type="html">Dissertation Research Log: Assessing cycling Network in the West Midlands using a LTN 1/20 adapted LTS Framework</title><link href="https://zhengpei-xu.github.io/posts/2026/03/dissertation-log/" rel="alternate" type="text/html" title="Dissertation Research Log: Assessing cycling Network in the West Midlands using a LTN 1/20 adapted LTS Framework" /><published>2026-03-05T00:00:00+00:00</published><updated>2026-03-05T00:00:00+00:00</updated><id>https://zhengpei-xu.github.io/posts/2026/03/Master%20Dissertation%20Log</id><content type="html" xml:base="https://zhengpei-xu.github.io/posts/2026/03/dissertation-log/"><![CDATA[<p><strong>Topic:</strong> Adapting the Level of Traffic Stress (LTS) Framework to a UK Context<br />
<strong>Case Study:</strong> West Midlands Area<br />
<strong>Supervisor:</strong> Prof. Duncan Smith (UCL CASA)<br />
<strong>Started:</strong> March 2026</p>

<hr />
<blockquote>
  <p>See also: <a href="/literature-reading/">Literature Reading</a></p>
</blockquote>

<h2 id="log-entries">Log Entries</h2>

<h3 id="2026-03-05--supervisor-meeting-1">2026-03-05 — Supervisor Meeting #1</h3>

<p><code class="language-plaintext highlighter-rouge">Meeting</code> · Prof. Duncan Smith</p>

<ul>
  <li>Spatial scale needs narrowing — confirm with TfWM that a scope adjustment is acceptable</li>
  <li>Road-level analysis cannot predict need for new infrastructure; frame limitations clearly</li>
  <li>Reference local council Low Traffic Neighbourhood (AKA.LTN) proposals and TfL Cycle Superhighways as context</li>
  <li>Quantifiable metrics for sub-criteria still unresolved</li>
  <li>ML methodology: role and application within the framework not yet defined</li>
</ul>

<p><strong>Action Items</strong></p>
<ul class="task-list">
  <li class="task-list-item"><input type="checkbox" class="task-list-item-checkbox" disabled="disabled" />Follow up with TfWM on scope/scale adjustment</li>
  <li class="task-list-item"><input type="checkbox" class="task-list-item-checkbox" disabled="disabled" />Read Duncan and Philyoung’s prior co-authored papers</li>
  <li class="task-list-item"><input type="checkbox" class="task-list-item-checkbox" disabled="disabled" />Identify available datasets for the West Midlands</li>
</ul>

<p><strong>Open Questions</strong></p>
<ul>
  <li>What is the appropriate spatial scale for this study?</li>
  <li>Which sub-criteria can realistically be quantified?</li>
</ul>

<hr />

<h3 id="2026-03-12--methodology-development">2026-03-12 — Methodology Development</h3>

<p><code class="language-plaintext highlighter-rouge">Writing</code> · LTS Framework Adaptation</p>

<p>Drafted the core rationale for the UK-adapted LTS framework. Existing frameworks were developed for the North American road environment; the proposed adaptation replaces American-origin thresholds with LTN 1/20 design standards — producing a framework directly grounded in the standards against which West Midlands cycling schemes will be assessed.</p>

<p><strong>Decisions Made</strong></p>
<ul>
  <li>LTN 1/20 thresholds replace North American equivalents as the primary source of design standards</li>
  <li>Framework remains road-segment based (consistent with original LTS methodology)</li>
</ul>

<p><strong>Still Unresolved</strong></p>
<ul>
  <li>Intersection stress: how to map LTN 1/20 guidance onto intersection-level indicators</li>
  <li>Weighted aggregation vs. parallel dimensions — aggregation logic not yet decided</li>
</ul>

<p><strong>Next Steps</strong></p>
<ul class="task-list">
  <li class="task-list-item"><input type="checkbox" class="task-list-item-checkbox" disabled="disabled" />Build indicator crosswalk table: LTS indicators ↔ LTN 1/20 equivalents</li>
  <li class="task-list-item"><input type="checkbox" class="task-list-item-checkbox" disabled="disabled" />Review Furth &amp; Nixon (2016) intersection stress methodology</li>
</ul>

<hr />

<h3 id="2026-04-22--data-ethics--tfwm-data-receipt">2026-04-22 — Data Ethics &amp; TfWM Data Receipt</h3>

<p><code class="language-plaintext highlighter-rouge">Ethics</code> · <code class="language-plaintext highlighter-rouge">Admin</code></p>

<p>UCL ethics forms in progress: Form A (Screening), Form B (Data Protection), Website Application.</p>

<p>Received data from TfWM this week:</p>
<ul>
  <li>Compass IoT Near Miss Data</li>
  <li>iRAP Road Safety Assessment Star Ratings Data</li>
  <li><a href="https://selfserve.datainsight.org.uk/mapview">TfWM Self-Serve portal</a></li>
</ul>

<p><strong>Next Steps</strong></p>
<ul class="task-list">
  <li class="task-list-item"><input type="checkbox" class="task-list-item-checkbox" disabled="disabled" />Submit completed ethics forms</li>
  <li class="task-list-item"><input type="checkbox" class="task-list-item-checkbox" disabled="disabled" />Audit received datasets for completeness and coverage</li>
</ul>

<hr />

<h3 id="2026-05-08--literature-reading--jeongs-lts-reproducibility">2026-05-08 — Literature reading &amp; Jeong’s LTS Reproducibility</h3>

<p><code class="language-plaintext highlighter-rouge">Meeting</code> · <code class="language-plaintext highlighter-rouge">Coding</code></p>

<p>Reproducing Jeong’s LTS Methodology:</p>
<ul>
  <li>Getting a initial LTS map of West Midland Area</li>
  <li>Finishing reading Mekuri/ Conveyal/ Jeong’s LTS (initially)</li>
</ul>

<p>While further reading / work are needed, especially concerning <strong>the whole frame of methodology</strong> (how to frame with LTN 1/20). Figuring out what TfWM can benefit from, and making the methods easier to understand. Maybe I have to build it under a wider background, should not be limited within LTS?</p>

<p><strong>Next Steps</strong></p>
<ul class="task-list">
  <li class="task-list-item"><input type="checkbox" class="task-list-item-checkbox" disabled="disabled" />Making some sliders for TfWM (DDL: 20/5/2026)</li>
  <li class="task-list-item"><input type="checkbox" class="task-list-item-checkbox" disabled="disabled" />presentation and communication with Jeong, preparing some questions in advance (DDL 13/5/2026)!!</li>
  <li class="task-list-item"><input type="checkbox" class="task-list-item-checkbox" disabled="disabled" />Buffer Zone: Do i really need it? do some reading.</li>
</ul>

<hr />

<h3 id="2026-05-20--tfwm-meeting-deliverables-confirmed--next-steps">2026-05-20 — TfWM Meeting: Deliverables Confirmed &amp; Next Steps</h3>

<p><code class="language-plaintext highlighter-rouge">Meeting</code> · <code class="language-plaintext highlighter-rouge">Decision</code></p>

<p>Met with TfWM. Callum confirmed the three final deliverables for the dissertation, so the overall direction is now locked in. The ask is clearly industry-facing — a commercial report plus a presentation suggests TfWM wants something they can actually use and circulate internally, not just an academic analysis. This also means the rationale for which LTN 1/20 metrics are included vs excluded needs to be very explicit: what can be answered with data, what can’t, and why each one is in or out.</p>

<p><strong>Decisions Made</strong></p>
<ul>
  <li>Final deliverables confirmed as three components:
    <ul>
      <li>a) A classification of LTN 1/20 metrics by operability — which can be quantified / improved through data, and which are inherently subjective and harder to fold into an automated network-scale assessment</li>
      <li>b) A commercial report for TfWM</li>
      <li>c) A final presentation to TfWM</li>
    </ul>
  </li>
  <li>Next meeting (Fri 29/5) deliverables specified by Callum (see Next Steps)</li>
</ul>

<p><strong>Open Questions</strong></p>
<ul>
  <li>Format and depth of the commercial report — page count, structure, whether an executive summary is expected. Needs confirming with Callum.</li>
  <li>Criteria for including/excluding metrics — purely data availability, or also methodological rigour and TfWM’s intended use case?</li>
  <li>Audience for the final presentation — technical team only, or also policy / decision-makers? This shapes the framing.</li>
</ul>

<p><strong>Next Steps</strong></p>
<ul class="task-list">
  <li class="task-list-item"><input type="checkbox" class="task-list-item-checkbox" disabled="disabled" />Prepare slides for next Friday’s meeting detailing progress so far (DDL: 29/5/2026)</li>
  <li class="task-list-item"><input type="checkbox" class="task-list-item-checkbox" disabled="disabled" />List which LTN 1/20 metrics will be answered, and which won’t</li>
  <li class="task-list-item"><input type="checkbox" class="task-list-item-checkbox" disabled="disabled" />Write justification for excluded metrics (data limitation / subjectivity / scope)</li>
  <li class="task-list-item"><input type="checkbox" class="task-list-item-checkbox" disabled="disabled" />Finalise the LTN 1/20-enhanced LTS framework and send to Duncan for review</li>
  <li class="task-list-item"><input type="checkbox" class="task-list-item-checkbox" disabled="disabled" />Draft a plan for the next few weeks of data analysis work</li>
  <li class="task-list-item"><input type="checkbox" class="task-list-item-checkbox" disabled="disabled" />Compile potential interview questions (for stakeholders)</li>
</ul>

<hr />

<!-- TEMPLATE

### YYYY-MM-DD — [Short title]

`Meeting` / `Writing` / `Data` / `Reading` / `Decision` / `Ethics` / `Admin`

[Narrative or bullet summary]

**Decisions Made**
**Open Questions**
**Next Steps**
- [ ] ...

-->]]></content><author><name>Zhengpei(Pippin) Xu</name><email>zhengpei_xu@outlook.com</email><uri>https://zhengpei-xu.github.io</uri></author><category term="Dissertation" /><category term="Cycling" /><category term="LTS" /><summary type="html"><![CDATA[Topic: Adapting the Level of Traffic Stress (LTS) Framework to a UK Context Case Study: West Midlands Area Supervisor: Prof. Duncan Smith (UCL CASA) Started: March 2026]]></summary></entry><entry><title type="html">Spatial Interaction Models: Historical Development and Formulations</title><link href="https://zhengpei-xu.github.io/posts/2026/02/Spatial%20Interaction%20Models-Historical%20Development%20and%20Formulations/" rel="alternate" type="text/html" title="Spatial Interaction Models: Historical Development and Formulations" /><published>2026-02-14T00:00:00+00:00</published><updated>2026-02-14T00:00:00+00:00</updated><id>https://zhengpei-xu.github.io/posts/2026/02/Historical%20Development%20of%20Spatial%20Interaction%20Models</id><content type="html" xml:base="https://zhengpei-xu.github.io/posts/2026/02/Spatial%20Interaction%20Models-Historical%20Development%20and%20Formulations/"><![CDATA[<p>This summary traces the chronological development and refinement of Spatial Interaction Models (SIM) based on Michael Batty’s lecture.</p>

<h2 id="origins-the-gravity-model">Origins: The Gravity Model</h2>

<p>The intellectual roots of spatial interaction models lie in an analogy with Newtonian physics. The first to apply gravitational logic to human movement was <strong>Henry Carey (1858)</strong>, who observed that human migration between cities followed patterns resembling gravitational attraction. This idea was formalised mathematically by <strong>Ernst Ravenstein (1885)</strong> in his <em>Laws of Migration</em>, where he established empirically that migration intensity decreases with distance.</p>

<p>The first explicitly gravitational formulation came from <strong>E.G. Young (1924)</strong> and was later popularised by <strong>George Zipf (1946)</strong>, who proposed the <strong>P₁P₂/D rule</strong>:</p>

\[T_{ij} = k \frac{P_i P_j}{d_{ij}}\]

<p>where $T_{ij}$ is the interaction between places $i$ and $j$, $P_i$ and $P_j$ are their populations, $d_{ij}$ is the distance separating them, and $k$ is a proportionality constant. This model treats population as the sole “mass” generating interaction, and assumes flows decay linearly with distance.</p>

<p>The astronomer <strong>John Stewart (1941)</strong> then introduced the concept of <strong>demographic potential</strong> — a measure of the cumulative gravitational pull exerted on one place by all others:</p>

\[V_i = \sum_j \frac{P_j}{d_{ij}^\beta}\]

<p>Stewart’s contribution was to generalise the distance exponent to $\beta$, recognising that the rate of distance decay was an empirical question rather than a physical constant. This $\beta$ parameter — the <strong>distance decay parameter</strong> — became the central object of interest in all subsequent SIM development. A high $\beta$ means flows are very sensitive to distance (steep decay); a low $\beta$ means people are willing to travel further.</p>

<h2 id="the-general-gravity-model">The General Gravity Model</h2>

<p>Building on Stewart and Zipf, the <strong>general unconstrained gravity model</strong> takes the form:</p>

\[T_{ij} = k \cdot V_i^\mu \cdot W_j^\alpha \cdot d_{ij}^{-\beta}\]

<table>
  <thead>
    <tr>
      <th>Term</th>
      <th>Definition</th>
      <th>Role</th>
    </tr>
  </thead>
  <tbody>
    <tr>
      <td>$T_{ij}$</td>
      <td>Predicted flow from $i$ to $j$</td>
      <td>Dependent variable</td>
    </tr>
    <tr>
      <td>$k$</td>
      <td>Global scaling constant</td>
      <td>Calibrates total flow volume</td>
    </tr>
    <tr>
      <td>$V_i$</td>
      <td>Origin mass (e.g. population)</td>
      <td>Measures emissiveness of origin</td>
    </tr>
    <tr>
      <td>$W_j$</td>
      <td>Destination mass (e.g. store area, jobs)</td>
      <td>Measures attractiveness of destination</td>
    </tr>
    <tr>
      <td>$d_{ij}$</td>
      <td>Distance or cost between $i$ and $j$</td>
      <td>Deterrence term</td>
    </tr>
    <tr>
      <td>$\mu, \alpha$</td>
      <td>Mass sensitivity parameters</td>
      <td>How strongly origin/destination size drives flows</td>
    </tr>
    <tr>
      <td>$\beta$</td>
      <td>Distance decay parameter</td>
      <td>How rapidly flows diminish with distance</td>
    </tr>
  </tbody>
</table>

<p>The parameters $\mu$, $\alpha$, and $\beta$ are estimated from observed flow data. <strong>No marginal totals are constrained</strong> — both origin and destination flows are free to vary. This makes the model maximally flexible but less predictively accurate, since it cannot guarantee that predicted flows sum to known totals.</p>

<p><strong>Typical applications:</strong> inter-regional trade flows; early migration studies; telephone communication patterns — any context where neither origin totals nor destination totals are independently known.</p>

<h2 id="wilsons-entropy-maximising-framework-and-the-sim-family-196771">Wilson’s Entropy-Maximising Framework and the SIM Family (1967–71)</h2>

<p>The most important theoretical advance came from <strong>Alan Wilson (1967, 1971)</strong>, who derived the entire family of spatial interaction models from first principles using <strong>entropy maximisation</strong>. Rather than relying on the physics analogy, Wilson asked: <em>given what we know about total flows, what is the most probable distribution of individual trips?</em> Maximising entropy subject to constraints on observed totals yields exactly the gravity model family — but now with a rigorous statistical foundation.</p>

<p>Crucially, Wilson showed that the appropriate model form depends entirely on <strong>which marginal totals are known and should be treated as constraints</strong>. This gave rise to three distinct models.</p>

<h3 id="unconstrained-model">Unconstrained Model</h3>

<p>Used when neither $O_i$ nor $D_j$ are known. Wilson showed this corresponds to maximising entropy with only a constraint on total travel cost.</p>

\[T_{ij} = k \cdot V_i^\mu \cdot W_j^\alpha \cdot f(c_{ij})\]

<p><strong>Typical applications:</strong> exploratory analysis of interaction patterns; inter-regional trade; contexts where no marginal totals can be independently observed.</p>

<h3 id="production-constrained-model">Production-Constrained Model</h3>

<p>When the total flow <strong>leaving each origin</strong> $O_i$ is known (e.g. total shopping trips from a residential zone, derived from population), it should be held fixed. Wilson introduced a <strong>balancing factor</strong> $A_i$ to enforce this:</p>

\[T_{ij} = A_i \cdot O_i \cdot W_j^\alpha \cdot f(c_{ij})\]

\[A_i = \frac{1}{\displaystyle\sum_j W_j^\alpha \cdot f(c_{ij})}\]

<p>The constraint satisfied is:</p>

\[\sum_j T_{ij} = O_i \quad \forall i\]

<table>
  <thead>
    <tr>
      <th>Term</th>
      <th>Definition</th>
    </tr>
  </thead>
  <tbody>
    <tr>
      <td>$O_i$</td>
      <td>Known total outflow from origin $i$ (fixed)</td>
    </tr>
    <tr>
      <td>$A_i$</td>
      <td>Balancing factor ensuring outflows are conserved</td>
    </tr>
    <tr>
      <td>$W_j^\alpha$</td>
      <td>Destination attractiveness with sensitivity $\alpha$</td>
    </tr>
    <tr>
      <td>$f(c_{ij})$</td>
      <td>Cost/deterrence function (e.g. $e^{-\beta c_{ij}}$)</td>
    </tr>
    <tr>
      <td>$\beta$</td>
      <td>Distance decay parameter (estimated from data)</td>
    </tr>
  </tbody>
</table>

<p>Here $\alpha$ and $\beta$ are the only free parameters — origin mass is already encoded in $O_i$. The destination inflows $\sum_i T_{ij}$ are a <strong>model output</strong>, not an input.</p>

<p><strong>Typical applications:</strong> retail catchment modelling (flows from residential zones to supermarkets); journey-to-work where census commuter totals by origin are available; school choice modelling.</p>

<h3 id="attraction-constrained-model">Attraction-Constrained Model</h3>

<p>Symmetrically, when total <strong>inflow to each destination</strong> $D_j$ is known but origin totals are not:</p>

\[T_{ij} = B_j \cdot V_i^\mu \cdot D_j \cdot f(c_{ij})\]

\[B_j = \frac{1}{\displaystyle\sum_i V_i^\mu \cdot f(c_{ij})}\]

<p>The constraint satisfied is:</p>

\[\sum_i T_{ij} = D_j \quad \forall j\]

<p><strong>Typical applications:</strong> modelling flows <em>to</em> a fixed-capacity facility (hospital, airport) where total admissions or passengers are known; migration to cities where in-migration totals are recorded.</p>

<h3 id="doubly-constrained-model">Doubly Constrained Model</h3>

<p>When <strong>both</strong> $O_i$ and $D_j$ are known, both sets of balancing factors are applied simultaneously:</p>

\[T_{ij} = A_i \cdot O_i \cdot B_j \cdot D_j \cdot f(c_{ij})\]

\[A_i = \frac{1}{\displaystyle\sum_j B_j D_j f(c_{ij})}, \qquad B_j = \frac{1}{\displaystyle\sum_i A_i O_i f(c_{ij})}\]

<p>Since $A_i$ depends on $B_j$ and vice versa, these are solved <strong>iteratively</strong> (the Furness/IPF procedure) until convergence. Both constraints are satisfied simultaneously:</p>

\[\sum_j T_{ij} = O_i \quad \forall i \qquad \text{and} \qquad \sum_i T_{ij} = D_j \quad \forall j\]

<p>The only free parameter is $\beta$ — both mass terms are fully determined by observed data, leaving only the distance decay to estimate.</p>

<p><strong>Typical applications:</strong> transport planning trip distribution (four-step model); inter-regional migration where both in- and out-migration totals come from the census; freight movement between fixed origin and destination terminals.</p>

<h2 id="the-role-of-the-cost-function">The Role of the Cost Function</h2>

<p>All three constrained models require specifying $f(c_{ij})$. Two standard forms are:</p>

<table>
  <thead>
    <tr>
      <th>Form</th>
      <th>Equation</th>
      <th>Properties</th>
    </tr>
  </thead>
  <tbody>
    <tr>
      <td>Power</td>
      <td>$c_{ij}^{-\beta}$</td>
      <td>Heavy-tailed; suitable for long-distance flows</td>
    </tr>
    <tr>
      <td>Negative exponential</td>
      <td>$e^{-\beta c_{ij}}$</td>
      <td>Steep short-distance decay; preferred for urban trips</td>
    </tr>
  </tbody>
</table>

<p>For supermarket shopping — short, frequent, and urban — the <strong>negative exponential</strong> is standard, as most people are unwilling to travel more than a few kilometres and the deterrence effect is sharp.</p>

<h2 id="summary">Summary</h2>

<table>
  <thead>
    <tr>
      <th>Model</th>
      <th>Constraints</th>
      <th>Free Parameters</th>
      <th>Primary Use</th>
    </tr>
  </thead>
  <tbody>
    <tr>
      <td>Unconstrained</td>
      <td>None</td>
      <td>$k, \mu, \alpha, \beta$</td>
      <td>Exploratory, no known totals</td>
    </tr>
    <tr>
      <td>Production-constrained</td>
      <td>$O_i$ fixed</td>
      <td>$\alpha, \beta$</td>
      <td>Retail, commuting (known origins)</td>
    </tr>
    <tr>
      <td>Attraction-constrained</td>
      <td>$D_j$ fixed</td>
      <td>$\mu, \beta$</td>
      <td>Facility planning (known capacities)</td>
    </tr>
    <tr>
      <td>Doubly constrained</td>
      <td>$O_i$ and $D_j$ fixed</td>
      <td>$\beta$ only</td>
      <td>Transport planning, migration</td>
    </tr>
  </tbody>
</table>

<p>Wilson’s framework showed that these are not four separate models but <strong>one unified family</strong>, differentiated only by which empirical constraints are imposed. This theoretical unification, combined with the entropy-maximising derivation, transformed spatial interaction modelling from a physics analogy into a rigorous applied framework — and laid the foundation for every land use and transport model that followed.</p>

<h2 id="references">References</h2>

<p>Carey, H.C. (1858) <em>Principles of Social Science</em>. Philadelphia: J.B. Lippincott.</p>

<p>Fotheringham, A.S. and O’Kelly, M.E. (1989) <em>Spatial Interaction Models: Formulations and Applications</em>. Dordrecht: Kluwer Academic Publishers.</p>

<p>Furness, K.P. (1965) ‘Time function iteration’, <em>Traffic Engineering and Control</em>, 7(7), pp. 458–460.</p>

<p>Hansen, W.G. (1959) ‘How accessibility shapes land use’, <em>Journal of the American Institute of Planners</em>, 25(2), pp. 73–76.</p>

<p>Ravenstein, E.G. (1885) ‘The laws of migration’, <em>Journal of the Statistical Society of London</em>, 48(2), pp. 167–235.</p>

<p>Stewart, J.Q. (1941) ‘An inverse distance variation for certain social influences’, <em>Science</em>, 93(2404), pp. 89–90.</p>

<p>Wilson, A.G. (1967) ‘A statistical theory of spatial distribution models’, <em>Transportation Research</em>, 1(3), pp. 253–269.</p>

<p>Wilson, A.G. (1971) <em>Entropy in Urban and Regional Modelling</em>. London: Pion.</p>

<p>Zipf, G.K. (1946) ‘The P1 P2/D hypothesis: On the intercity movement of persons’, <em>American Sociological Review</em>, 11(6), pp. 677–686.</p>]]></content><author><name>Zhengpei(Pippin) Xu</name><email>zhengpei_xu@outlook.com</email><uri>https://zhengpei-xu.github.io</uri></author><category term="Spatial Interaction Models" /><summary type="html"><![CDATA[This summary traces the chronological development and refinement of Spatial Interaction Models (SIM) based on Michael Batty’s lecture.]]></summary></entry></feed>