
Visco-Cruise: An Agent-Based Model of Taxi and FHV Cruising Behaviour in Midtown Manhattan
Published:
Concepts
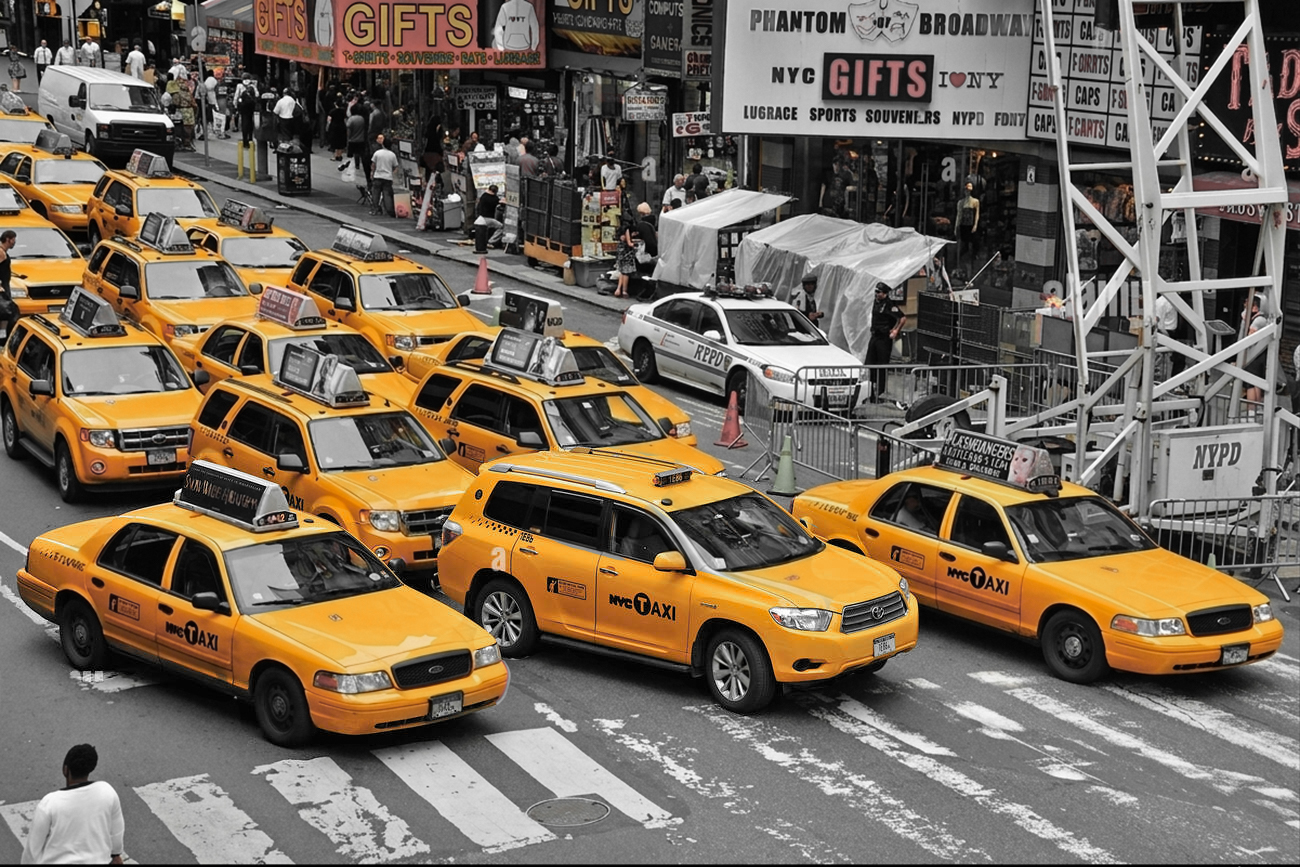
In January 2025, New York City introduced congestion pricing for its Central Business District, reducing vehicle entries by 11% (Cook et al. 2025). Ostrovsky and Yang (2024) show this reduction is driven predominantly by private vehicles. Taxis and FHVs, which are responsible for over 52% of CBD traffic (Traffic Mobility Review Board 2023) and unoccupied nearly half the time (Cramer and Krueger 2016), face lower per-trip charges and remain largely unaffected. Schaller (2017) estimates that eliminating unnecessary cruising of taxis and FHVs could reduce total CBD VMT by 7–11%, highlighting vacant cruising as a significant lever for congestion relief. However, aggregate metrics such as VMT fail to capture the impact of taxis and FHVs cruising, because congestion is a highly dynamic process shaped by real-time driver behaviour and spatial structure. In this context, agent-based modelling with its bottom-up architecture can provide a powerful framework to simulate these individual-level behaviours and observe how they evolve into system-wide congestion.
Existing agent-based models have been applied to simulate taxi pickup-dropoff cycles and fleet efficiency (Salanova Grau et al. 2013; Ranjit et al. 2018), and to assess the system-wide VMT impacts of autonomous vehicle rebalancing (Fagnant and Kockelman 2014; Azevedo et al. 2020). Neither strand models human-driven fleets with heterogeneous cruising strategies on a congested network. Building on the taxi pickup-dropoff paradigm, this Visco-Cruising model fills that gap by embedding distinct taxi and FHV cruising behaviours within a calibrated Manhattan grid and TLC demand data, revealing how bottom-up search strategies shape macro-level traffic and informing mixed-fleet policy decisions.
Following the ODD Design Concepts framework (Grimm et al. 2020), this model captures sensing (taxis’ 10-patch demand scanning vs FHVs’ passive dispatch), interaction (occupancy-based blocking by red signals or vehicles ahead), and stochasticity (TLC-calibrated passenger spawning). These micro-level behaviours give rise to localised congestion and fleet-level differences in dead miles, observed through system average speed, cumulative trips, and per-trip dead miles by vehicle type.
Partial ODD Description
1.1 Purpose and Patterns
This model investigates the following research question: How do the heterogeneous vacant-cruising strategies of taxis and for-hire vehicles (e.g. Uber, Lyft) differentially shape traffic congestion within Midtown Manhattan’s CBD?
Note: For-hire vehicles are henceforth referred to as FHVs in this text.
In this context, cruising refers to the movement of vacant for-hire vehicles searching for passengers — a behaviour distinct from directed trip delivery and responsible for a significant share of urban vehicle kilometres travelled (Schaller 2017). Taxi drivers’ cruising strategy is rooted in local spatial experience, where they deliberately head for and slow down in high-demand zones to scan the kerbside for passengers. In contrast, FHV drivers primarily navigate under platform allocation mechanisms with more direct trajectories (Millard-Ball et al. 2023). Based on this, the validity of this model can be verified through the following patterns:
- Strategic Clustering: Taxis manifest intense spatial clustering in high-demand zones due to strategic cruising, whereas FHVs maintain a stochastic, uniform distribution, validating the emergent impact of heterogeneous cruising strategies.
- Asymmetric Congestion Sensitivity: As total vehicle number increases, average network speed should decrease. Moreover, increasing the number of taxis should disproportionately reduce average system speed relative to an equivalent increase in FHVs.
- Demand–Efficiency Coupling: Increased pickup demand should reduce competitive cruising and raise
global-average-speedas agents transition from low-speed cruising to full-speed delivery.
These patterns collectively reflect three core ODD Design Concepts. Strategic Clustering emerges from sensing: vacant taxis scan a 10-patch ahead radius and bias their heading toward high demand-intensity zones, a local perception mechanism absent in FHVs. Asymmetric Congestion Sensitivity reflects interaction: all vehicles are subject to occupancy-based blocking, so the denser spatial clustering of taxis propagates congestion shockwaves more intensely than the uniform distribution of FHVs. Demand–Efficiency Coupling is driven by stochasticity: passenger spawning is probabilistic and calibrated to TLC demand tiers, meaning supply–demand balance fluctuates each tick and produces the observed speed recovery under high demand.
1.2 Entities, State Variables, and Scales
The model consists of three primary entities: Vehicles (background traffic, taxis, and FHVs), Passengers (pickup demand), and Patches (Manhattan grid topology). Global variables monitor aggregate performance.
Agent behaviours are driven by vehicle-type and has-passenger? status. Patch-level variables, including demand-intensity and directional flags, enforce the street system and dictate cruising logic. All vehicles incorporate a reaction-delay to simulate startup inertia and congestion recovery. A complete list of state variables is provided in Table 1.
| Entity | Variable | Type | Description |
|---|---|---|---|
| Vehicles | vehicle-type | string | “taxi” (yellow), “FHV” (cyan), or “background traffic” (blue) |
has-passenger? | bool | Status flag: cruising phase or delivery phase (red) | |
target-patch | patch | Destination for delivery | |
is-congested? | bool | Movement blocked by vehicle immediately ahead | |
blocked-by-signal? | bool | Blocked by red light at intersection boundaries | |
did-move? | bool | Binary flag for calculating instantaneous speed | |
reaction-delay | int | Stochastic recovery timer (1–2 s) simulating startup inertia | |
| Passengers | destination-patch | patch | Assigned trip endpoint on non-intersection road |
| Patches | is-road?/is-intersection? | bool | Grid topology: road vs. intersection classification |
is-signal-here? | bool | Traffic light presence at intersection approaches | |
can-go-N/S/E/W? | bool | Hard constraints defining Manhattan’s one-way system | |
demand-intensity | float | Calibrated from TLC pickup density (Jan 2025): 1.0 (High, 6th–Park Ave), 0.5 (Mid, 8th–6th Ave), 0.2 (Low, peripheral); drives passenger spawning and taxi cruising viscosity | |
| Global | taxi/FHV-dead-miles | int | Cumulative search distance per vehicle type |
taxi/FHV-trips | int | Cumulative completed passenger deliveries | |
avg-dead-per-trip | float | Operational efficiency metric per vehicle type | |
global-average-speed | float | System-wide flow efficiency (ratio of moving agents) | |
baseline-speed-value | float | Pre-calculated reference speed for background traffic density | |
max-passengers | int | System-wide passenger cap (slider, default 30); limits concurrent demand to prevent oversaturation |
Table 1: Entities and State Variables. “FHV” represents For-Hire Vehicles (app-based ride-hailing). Binary flags (bool) are used for real-time metric aggregation.
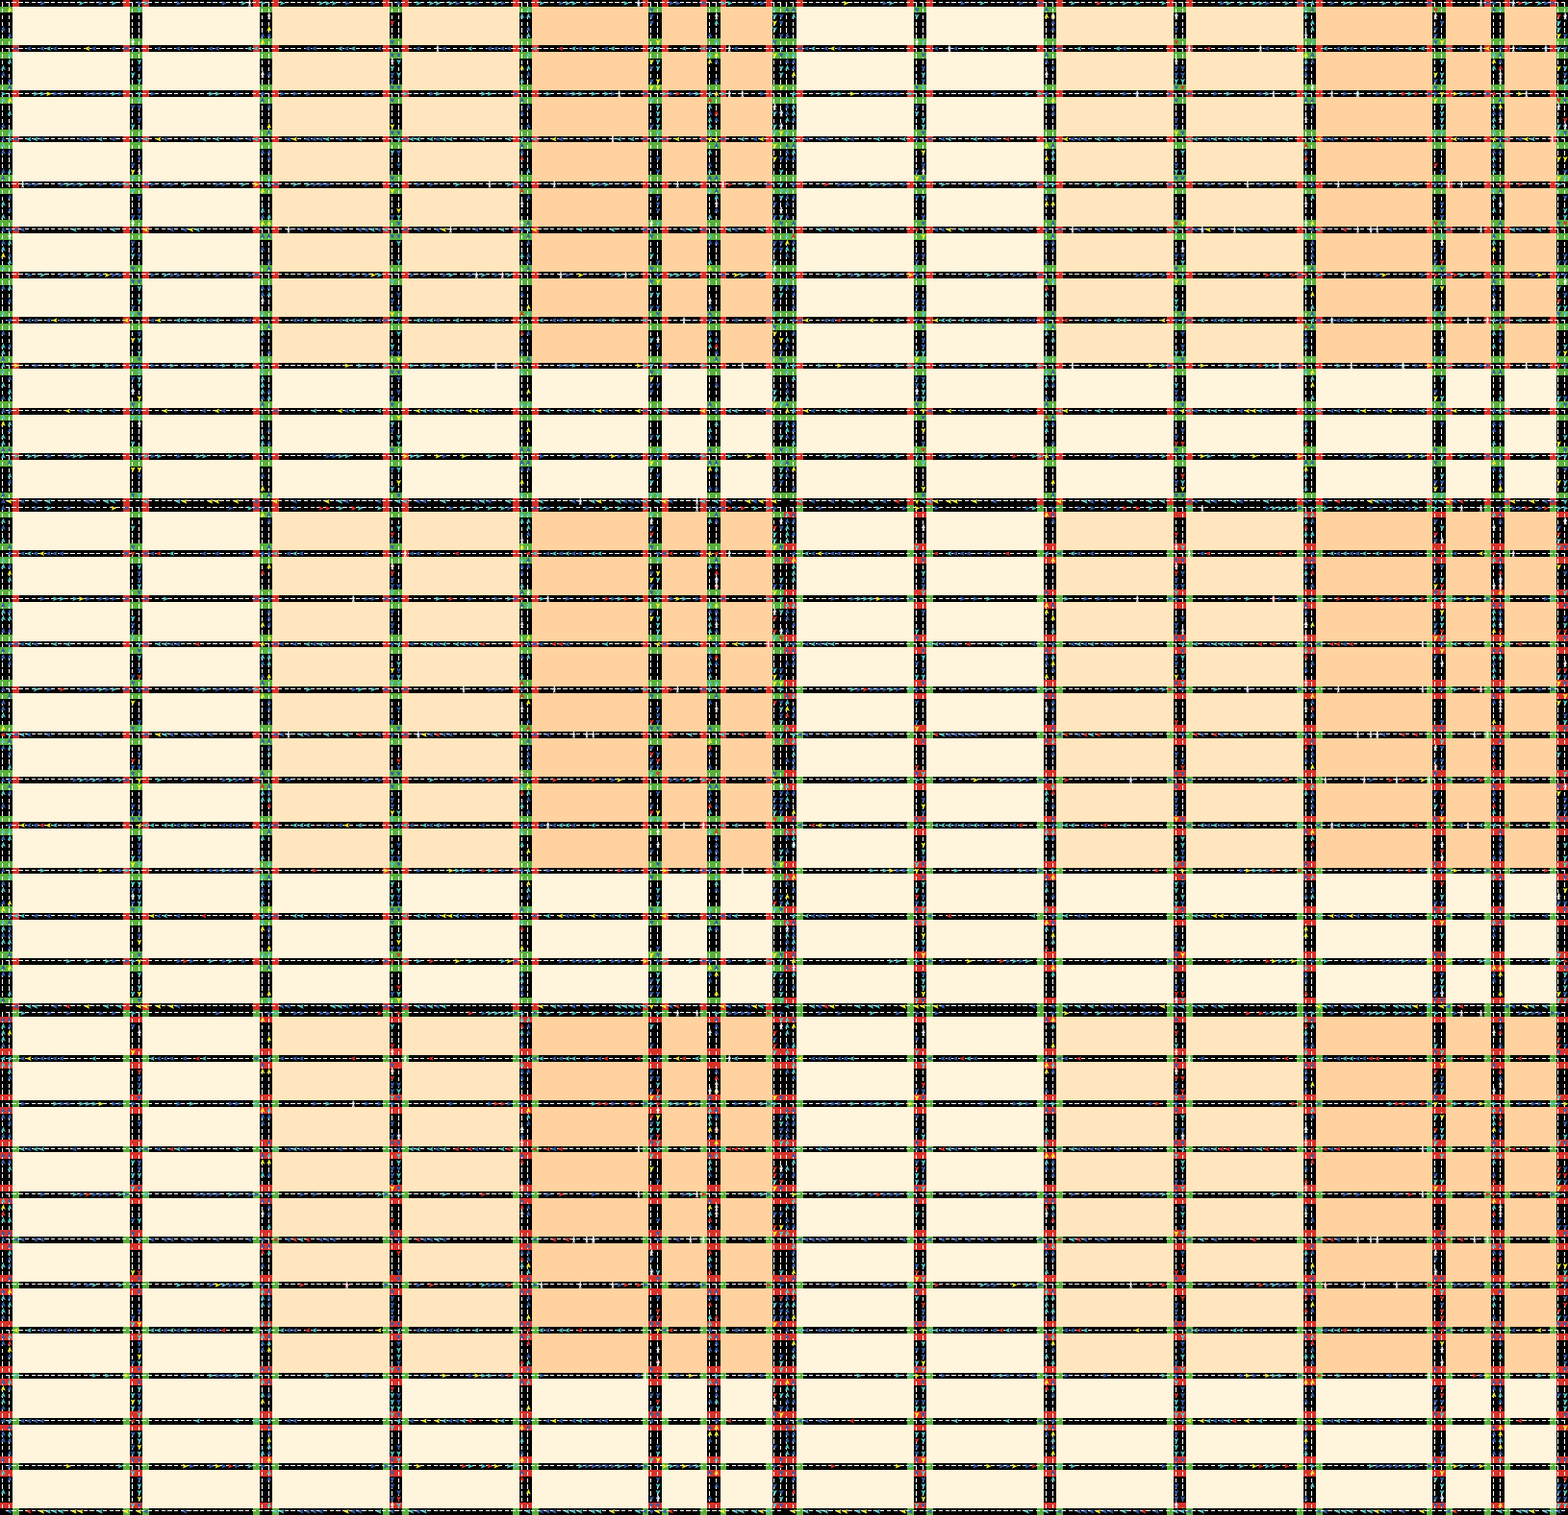
The world spans 121 × 78 square cells (with the origin (0,0) representing Times Square), each 10 m × 10 m in size, simulating the most congested part of Midtown Manhattan. Eight north–south avenue pairs (from 10th to Park Ave) and twelve east–west streets (from 50th to 39th Street) form the grid. The model uses a bounded, non-toroidal space to prevent “wrap-around” shortcuts. Each tick represents one second in the real world. Global variables track cumulative dead miles by vehicle type, trip counts, and speed metrics.
Note: The bounded space forces agents to use greedy navigation within the realistic grid constraints when delivering passengers.
Note: While each tick represents one second, the traffic signal cycle is shortened to a default of 5 ticks (vs. real-world 45–90 s) to prevent artificial gridlock at corners caused by the model’s limited spatial extent. Park Avenue (pxcor 59–60) is modelled as southbound-only; bidirectional flow caused persistent corner gridlock in initial tests.
1.3 Process Overview and Scheduling
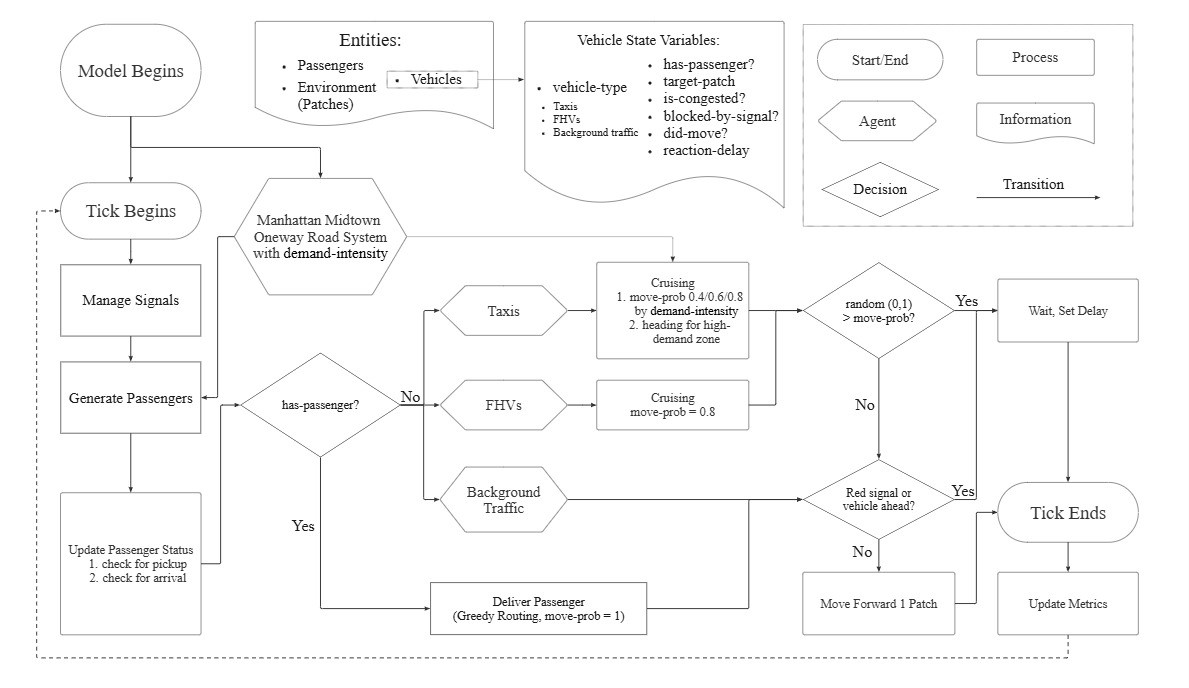
The model operates in discrete-time execution, with each tick proceeding through four synchronised phases (Figure 1): environment update (signal switching and stochastic passenger spawning), agent decision-making (type-specific cruising for vacant vehicles, greedy routing for occupied ones), physical execution (probabilistic movement with occupancy-based blocking), and data logging. Execution order within each agent class is randomised.
1.4 Initialisation
At $t = 0$, the environment is initialised as a 121 × 78 grid. Patches are assigned road (including intersection) or building attributes, with road patches receiving directional flags to enforce Manhattan’s one-way system and a demand-intensity value to drive passenger spawning and taxi cruising viscosity. Signal patches are identified as road patches adjacent to (but not including) intersections, placing stop lines at each junction entry. East–west streets are initialised green; north–south avenues are initialised red.
A total of $N$ vehicles are randomly distributed across road patches, initialised in a vacant state (no passenger, 2-tick reaction delay). Vehicle type is assigned stochastically: with probability commercial-vehicle-ratio (default 0.5) a vehicle is commercial, and among commercial vehicles, Taxi-vs-FHV-split (default 0.2) determines whether it is a taxi or FHV. All global performance metrics are reset to zero.
Note: The initial 2-tick delay is a synchronisation buffer to stagger vehicle start-up at $t = 0$, and should not be confused with the 1–2 tick
reaction-delaydynamically set during congestion recovery (see Section 1.6).
| Parameter | Description | Min | Max | Default |
|---|---|---|---|---|
num-cars | Total vehicle count | 200 | 1500 | 1000 |
commercial-vehicle-ratio | Fraction of vehicles that are taxi or FHV | 0.0 | 1.0 | 0.50 |
Taxi-vs-FHV-split | Fraction of commercial vehicles that are taxis | 0.0 | 1.0 | 0.20 |
max-passengers | Maximum concurrent passengers in the system | 0 | 60 | 30 |
length-of-green-light | Signal phase duration (ticks) | 1 | 10 | 5 |
Table 2: Model parameters and default values.
1.5 Input Data
The model incorporates static spatial input derived from the TLC Trip Record Data. January 2025 yellow taxi trip records were filtered for evening rush hour (17:00–18:00) and aggregated by avenue corridor, producing three discrete demand-intensity tiers (1.0 / 0.5 / 0.2) that drive both stochastic passenger spawning and taxi cruising viscosity. The three-tier abstraction preserves the east–west demand gradient of Midtown while keeping the model computationally tractable (Figure 2).
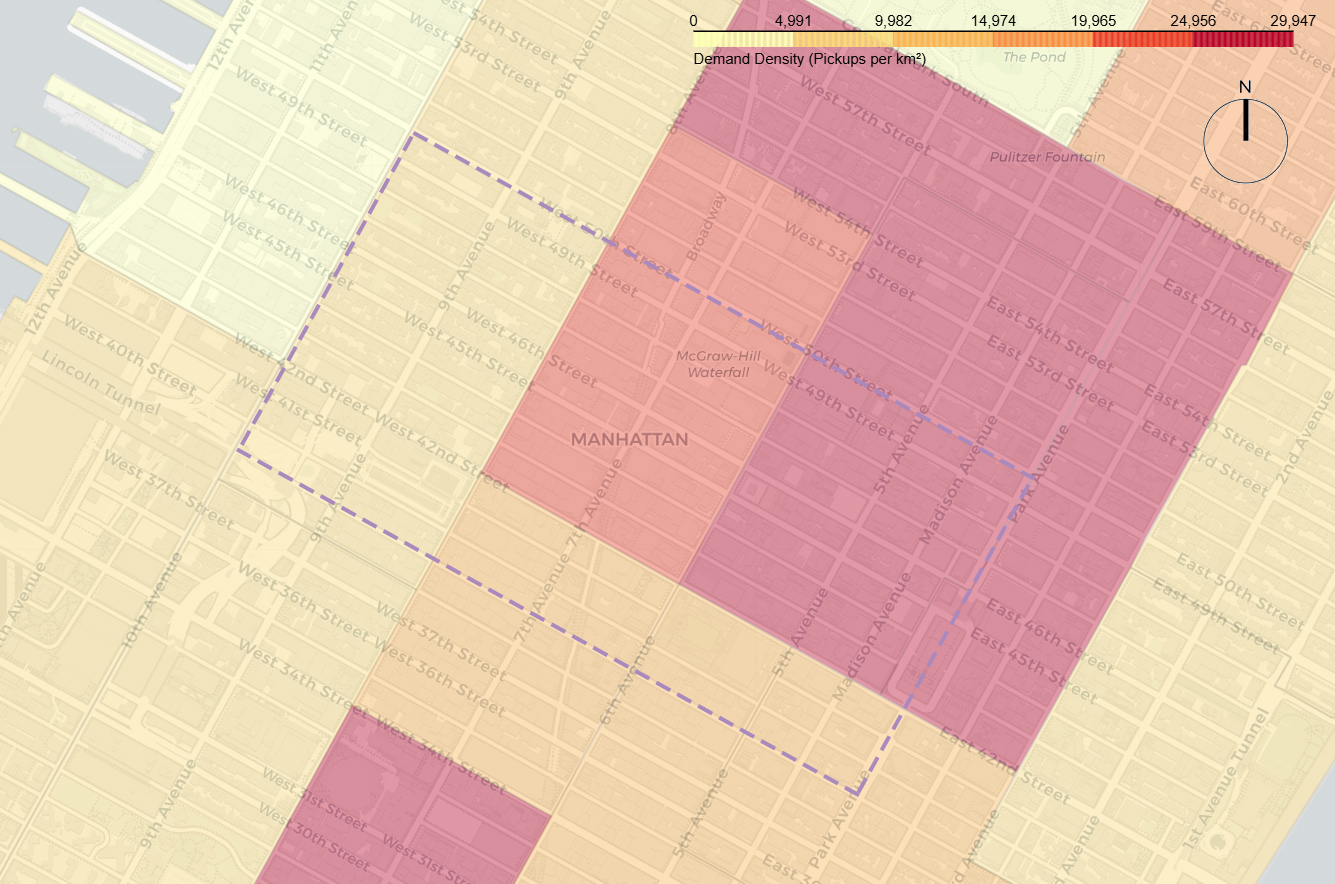
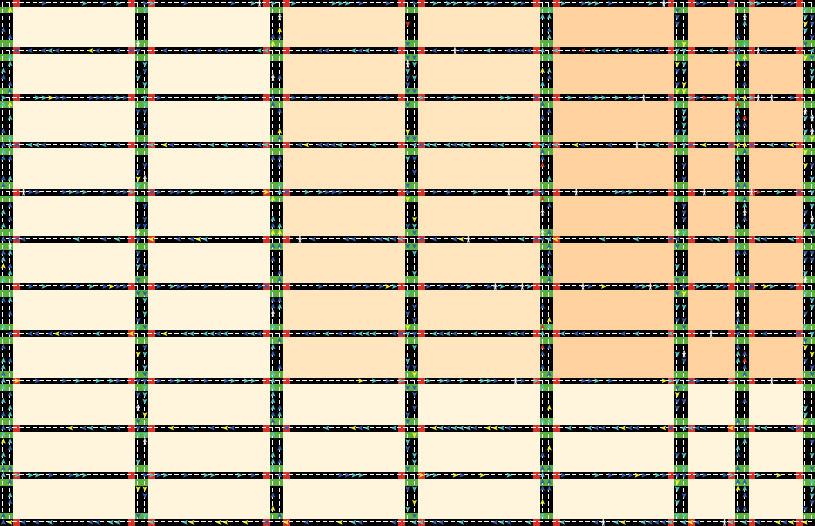
Figure 2: Calibration of the demand-intensity field. Empirical TLC pickup density (left) is aggregated into three discrete tiers along the east–west gradient (right), capturing the strong concentration of demand between 6th Avenue and Park Avenue.
1.6 Submodels
Signal Management. Every length-of-green-light ticks, the global Boolean flags row-green? and col-green? toggle simultaneously, so east–west streets and north–south avenues always hold opposite phases. Signal patches update their colour (green/red) accordingly each tick. At initialisation, east–west streets hold green and north–south avenues hold red.
Demand Spawning, Selection, and Delivery. Every tick, passengers are stochastically generated on non-intersection road patches with probability proportional to demand-intensity ($p = 0.05 \times \texttt{demand-intensity}$), subject to a system-wide cap of max-passengers. When a vacant vehicle (taxi or FHV) occupies a patch holding a passenger, its state toggles to has-passenger? = true and a random target-patch is assigned. Occupied vehicles then use a greedy algorithm that minimises the Manhattan distance to their destination, subject to the one-way street constraints. If no progress-making heading is available due to one-way constraints, a random legal heading is chosen to resolve the local dead-end.
Note: Manhattan distance ($L_1$) between two points $(x_1, y_1)$ and $(x_2, y_2)$ is $|x_2 - x_1| + |y_2 - y_1|$, i.e. the travel distance along a rectangular grid. It is the natural metric for Manhattan’s one-way street system, where diagonal movement is not permitted.
Heterogeneous Cruising. Vacant taxis scan a 10-patch radius ahead and rotate toward the heading with the highest cumulative demand-intensity with 80% probability (20% random exploration), and slow down in high-intensity zones (move-prob = 0.4, 0.6, or 0.8 depending on local demand), producing the cruising viscosity that gives the model its name. Vacant FHVs maintain undirected cruising at a constant move-prob = 0.8, reflecting passive platform dispatch. Background traffic moves randomly at full speed (move-prob = 1.0).
Physical Congestion. All movement is subject to two blocking conditions checked each tick. (i) Signal blocking: if the patch immediately ahead is an intersection and the relevant signal phase is red for the current heading direction, blocked-by-signal? is set true. (ii) Occupancy blocking: if any vehicle currently occupies the patch immediately ahead, is-congested? is set true. If either condition holds, the vehicle remains stationary and resets its reaction-delay to a random value between 1 and 2 ticks, simulating human start-up inertia and triggering emergent shockwaves that propagate backward along the queue.
References
Azevedo, C. L. et al. (2020) ‘Microsimulation of Demand and Supply of Autonomous Mobility-on-Demand Systems’, Transportation Research Record, 2674(10), pp. 1–14.
Cook, C. et al. (2025) The Short-Run Effects of Congestion Pricing in New York City. National Bureau of Economic Research Working Paper 33584. Available at: https://www.nber.org/papers/w33584
Cramer, J. and Krueger, A. B. (2016) ‘Disruptive Change in the Taxi Business: The Case of Uber’, American Economic Review, 106(5), pp. 177–182.
Fagnant, D. J. and Kockelman, K. M. (2014) ‘The Travel and Environmental Implications of Shared Autonomous Vehicles’, Transportation Research Part C: Emerging Technologies, 40, pp. 1–13.
Grimm, V. et al. (2020) ‘The ODD Protocol for Describing Agent-Based and Other Simulation Models: A Second Update to Improve Clarity, Replication, and Structural Realism’, Journal of Artificial Societies and Social Simulation, 23(2), p. 7.
Millard-Ball, A. et al. (2023) ‘Where Ridehail Drivers Go between Trips’, Transportation, 50(5), pp. 1959–1981.
Ostrovsky, M. and Yang, F. (2024) Effective and Equitable Congestion Pricing: New York City and Beyond. Tech. rep.
Ranjit, S. et al. (2018) ‘Agent-Based Modeling of Taxi Behavior Simulation with Probe Vehicle Data’, ISPRS International Journal of Geo-Information, 7(5).
Salanova Grau, J. M. et al. (2013) ‘Agent Based Modeling for Simulation of Taxi Services’, Journal of Traffic and Logistics Engineering, 1, pp. 159–163.
Schaller, B. (2017) Unsustainable? The Growth of App-Based Ride Services and Traffic, Travel and the Future of New York City. New York: Schaller Consulting.
Traffic Mobility Review Board (2023) Central Business District Tolling Program Recommendations. New York: Metropolitan Transportation Authority.