
Green Travel, Dirty Air? Why London’s Cyclists Are Still Exposed to the City’s Worst Pollution
Published:

Green Travel, Dirty Air?
In London, a clear blue sky does not always mean clean air. Research by Imperial College London estimates that air pollution contributes to over 4,000 premature deaths in the city each year (Imperial College London, 2021). That figure is a reminder that air quality is never an abstract environmental concern — it is a daily public health issue that shapes how Londoners experience their lives.
For commuters who walk or cycle, the stakes are especially immediate. Air quality is not a number on a monitoring screen. It is something they breathe in, minute by minute.
Why NO₂ Matters on London’s Streets
Urban air pollution is a mixture of harmful substances: fine particulate matter (PM₂.₅), nitrogen dioxide (NO₂), ozone (O₃), and sulphur dioxide (SO₂). This analysis focuses on NO₂ — not because it is the only dangerous pollutant, but because it is the most direct indicator of traffic-related exposure.
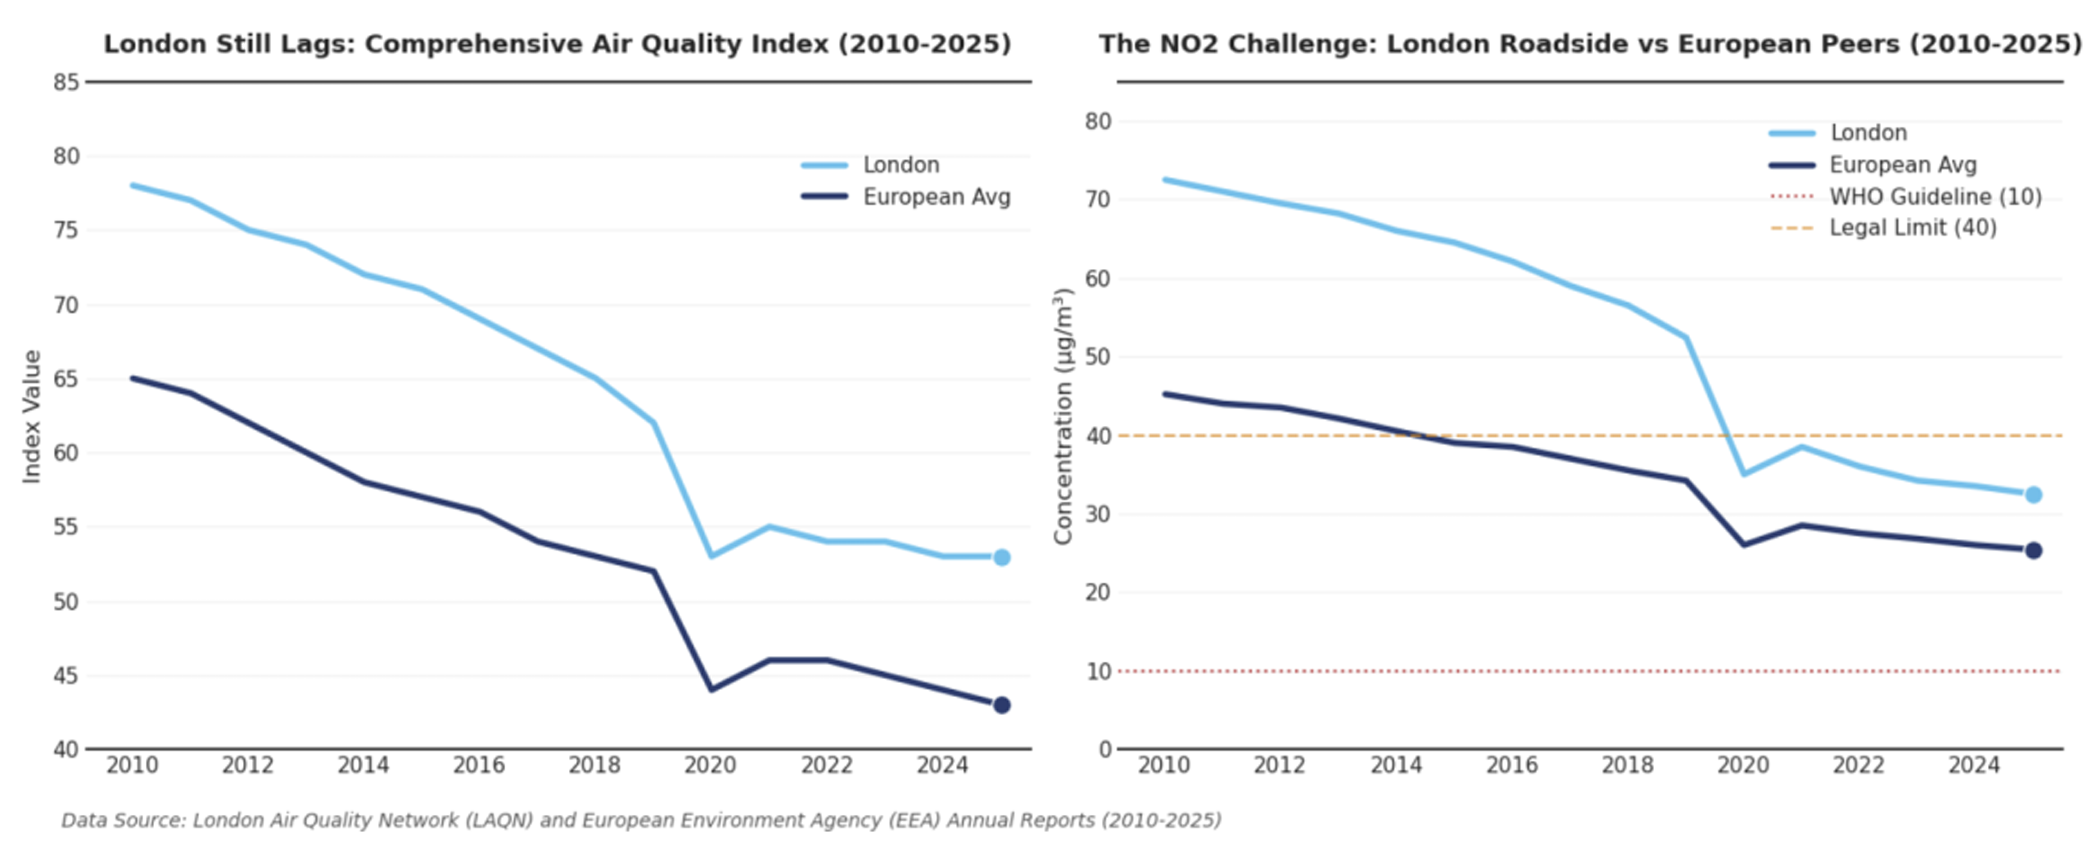
NO₂ is primarily emitted by vehicles, and concentrations tend to peak along busy roads and major junctions (WHO, 2021). Unlike PM₂.₅, which can travel long distances and originate far beyond the city, NO₂ largely reflects local traffic conditions. This makes it a practical tool for understanding how road transport affects air quality at street level. SO₂, by contrast, has ceased to be a major urban concern following the long-term decline of coal use and heavy industry in the UK (Defra, 2024).
London has made genuine progress. Average NO₂ concentrations have fallen in recent years and now sit below UK legal limits. However, they remain higher than the European average and continue to exceed the World Health Organization’s recommended guideline of 10 µg/m³ (WHO, 2021). Legal compliance and health safety are not the same thing — and for people travelling close to roads, the gap between the two still matters.
The Cyclist’s Paradox
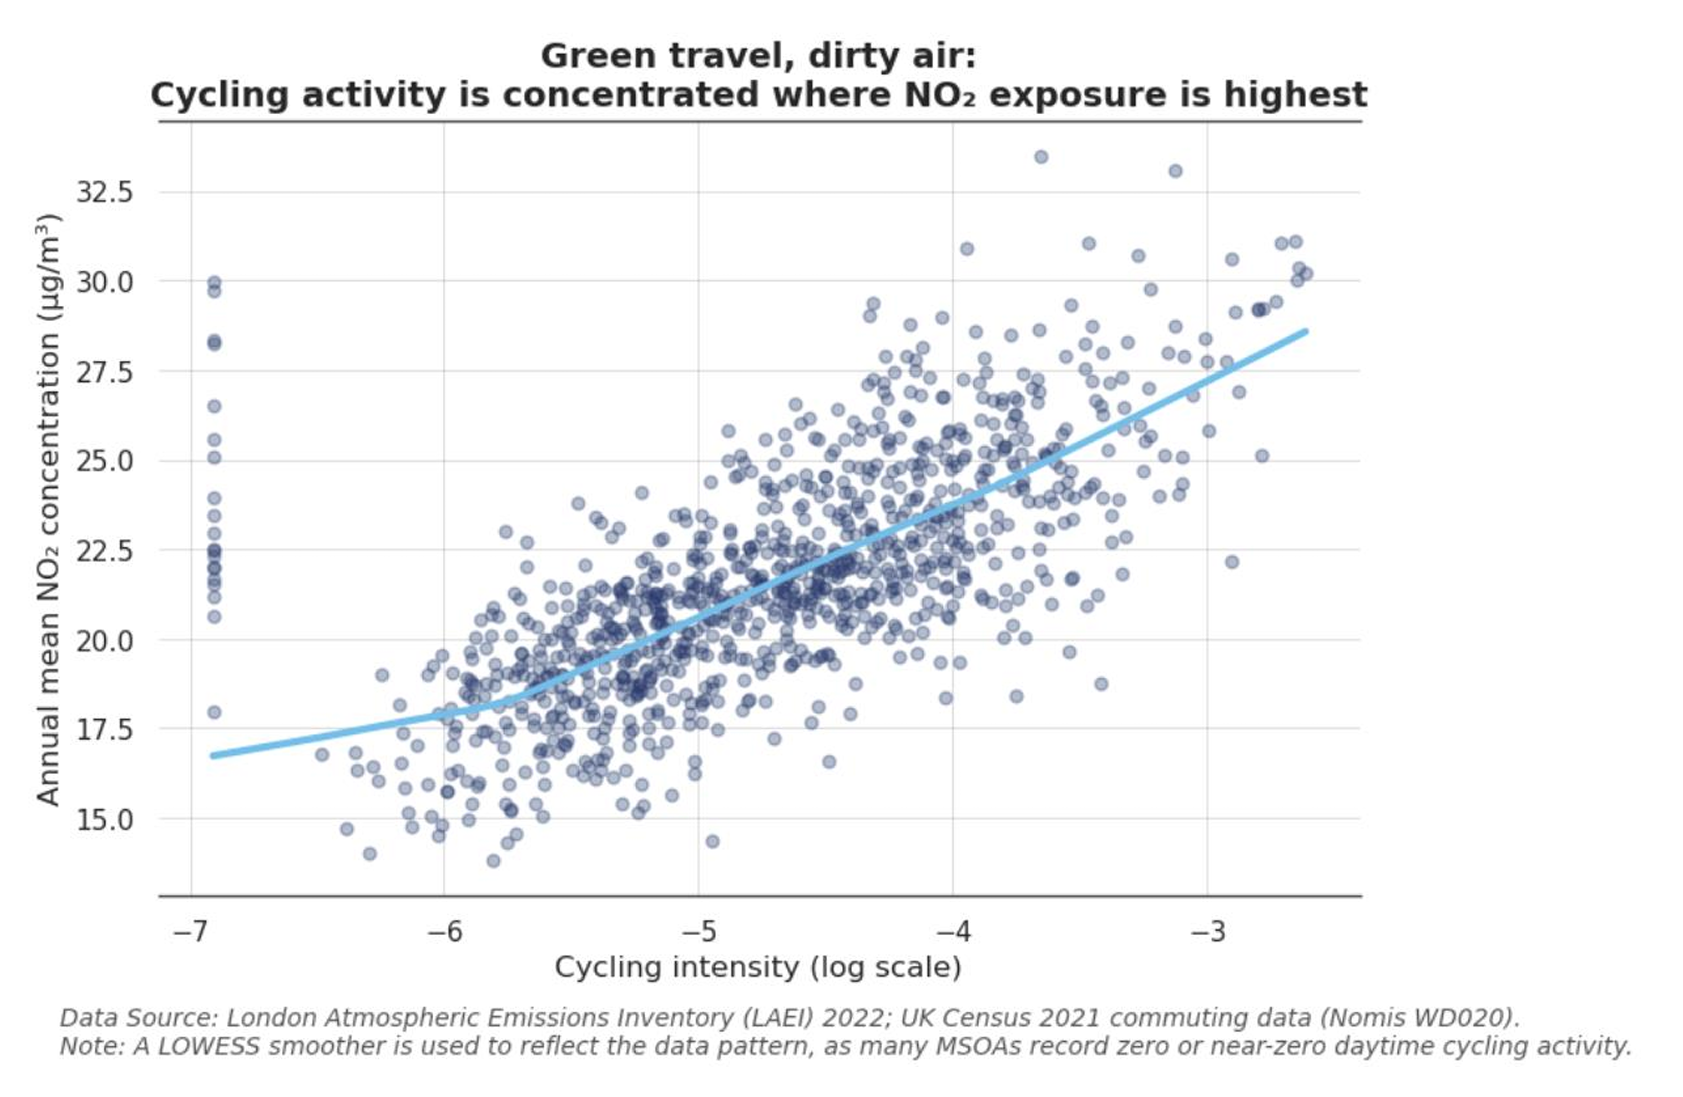
A substantial body of research links NO₂ exposure to respiratory and cardiovascular harm (COMEAP, 2018). Because concentrations are highest near roads, active travellers — cyclists and pedestrians — are often exposed more directly than people inside vehicles. But this exposure is not evenly distributed across the city.
An analysis of all 983 London neighbourhoods (Middle Layer Super Output Areas, or MSOAs) reveals a striking pattern: areas with the highest levels of cycling activity are also, on average, areas with higher NO₂ concentrations. After log-transforming cycling intensity to address skewness and fitting smoothed trends, the relationship becomes clear. Where cycling is denser, pollution exposure tends to be higher too.
This does not mean cycling causes pollution. Instead, it reflects how cycling activity is spatially organised within London. Much of the city’s cycling takes place along major transport corridors connecting employment centres, commercial areas, and public services. These same corridors carry the highest volumes of motor traffic — and the highest vehicle emissions. Cycling demand becomes physically and geographically tied to high-pollution environments. This is what can be called a spatial lock-in.
When Buildings Trap Pollution
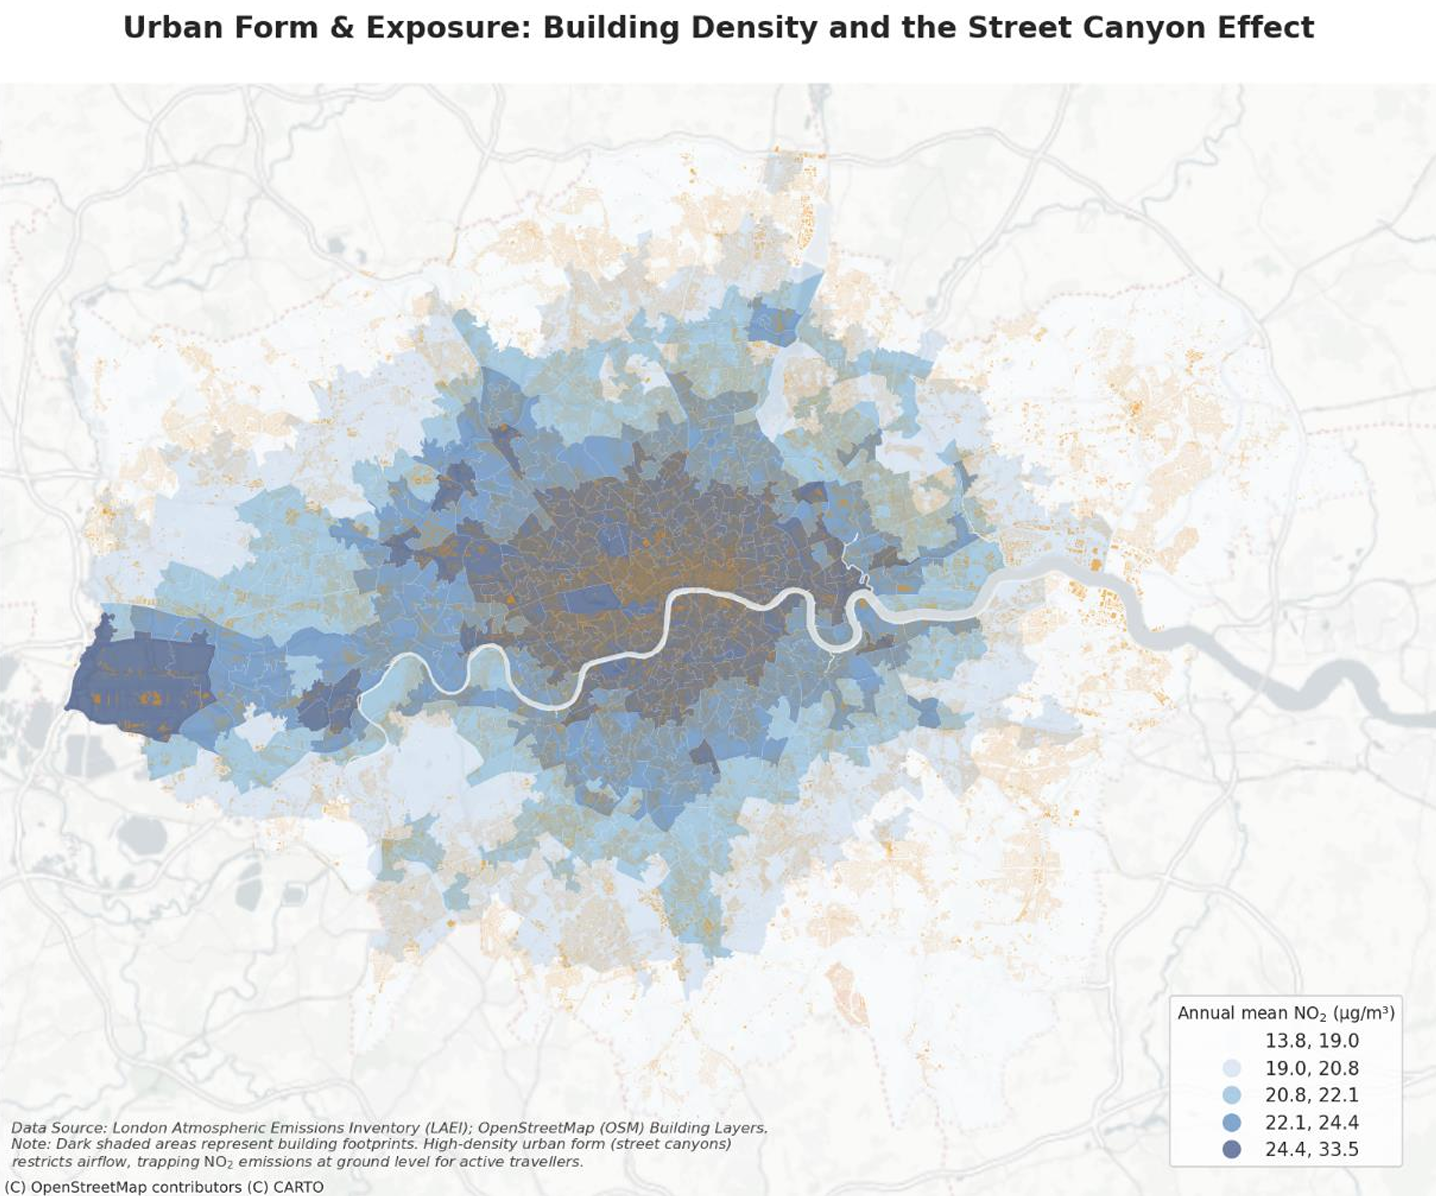
Traffic volumes alone do not fully explain the pattern. When urban form is included in the analysis, building density emerges as one of the strongest predictors of NO₂ exposure.
In dense parts of London, continuous rows of buildings create narrow street environments — commonly described as “street canyons”. These forms restrict airflow and inhibit the dispersal of pollutants, causing vehicle emissions to accumulate near ground level. Building density does not generate pollution on its own, but it amplifies the effect of traffic emissions and intensifies exposure for everyone moving through those spaces (Greater London Authority, 2022).
This physical environment makes conditions significantly worse for cyclists travelling through dense, heavily trafficked corridors — precisely the routes where cycling demand is highest.
Why More Cycle Lanes Are Not Always Enough
Cycling infrastructure is widely promoted as a lever for improving urban mobility and public health. But this analysis finds that, under current spatial conditions, the presence of cycle lanes has not meaningfully weakened the statistical relationship between cycling intensity and pollution exposure at the neighbourhood scale.
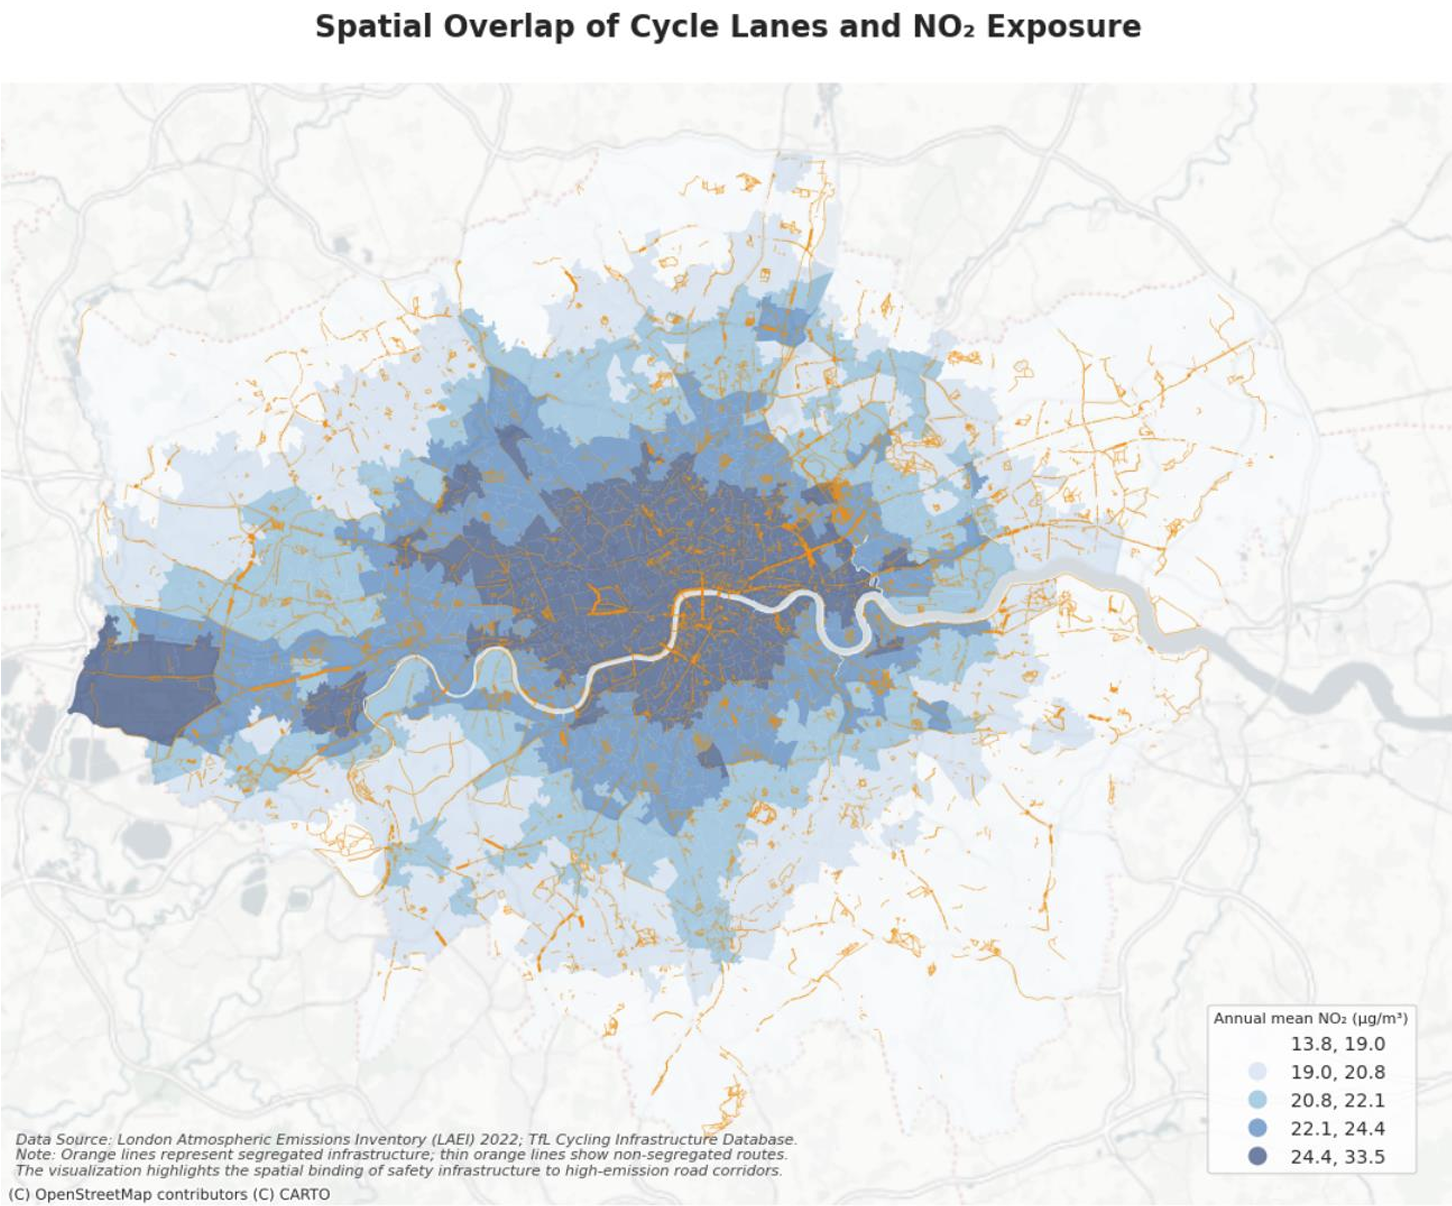
This is not an argument that cycle lanes are ineffective. Their impact depends strongly on where they are placed. When cycling infrastructure is added along busy roads with heavy traffic and poor ventilation, its ability to reduce pollution exposure is limited. Infrastructure alone cannot overcome the combined effects of traffic volume and urban form (Talbot et al., 2020).
Rethinking Where Cycling Happens
These findings point to a deeper challenge for urban policy. The relationship between cycling and air pollution is shaped by the interaction between travel demand, traffic intensity, and the built environment. Simply encouraging more people to cycle — or adding lanes along existing traffic corridors — does not automatically produce cleaner or healthier journeys.
Breaking London’s spatial lock-in requires a shift in focus: from whether cycling infrastructure exists to where it is placed and what kind of urban environment it runs through. Expanding cycling networks along lower-traffic streets, improving street-level ventilation, and redesigning how dense urban corridors function could offer more effective ways to protect cyclists’ health.
In a city committed to sustainable transport, clean mobility is not only about moving people efficiently. It is also about ensuring that choosing to cycle does not mean being locked into breathing some of the most polluted air the city has to offer.
Technical Appendix
This study employs a four-stage OLS regression framework to examine the “spatial lock-in” effect — the geographic coincidence between high cycling intensity and elevated NO₂ concentrations across London’s 983 MSOA units. The modelling objective is to detect the drivers of environmental exposure by isolating the roles of traffic pressure and urban physical form.
Variable Definition and Data Sources
| Variable | Symbol | Definition & Data Source | Transformation |
|---|---|---|---|
| Air Pollution | NO₂ | Annual mean concentration (LAEI 2022) | Linear |
| Cycling Intensity | C_int | Share of cycling commuters (Census 2021) | Logarithmic |
| Traffic Pressure | T_proxy | Road collision counts as a flow proxy (DfT) | Logarithmic |
| Physical Form | D_built | Building footprint density (OSM) | Linear |
| Infrastructure | I_score | Weighted supply of cycle lanes (TfL) | Logarithmic |
Cycling infrastructure was weighted at 1.0 for segregated lanes and 0.7 for painted lanes, consistent with Talbot et al. (2020) [see reference note], who find that standard road markings offer weaker environmental protection than separated tracks in high-density corridors.
Data Processing
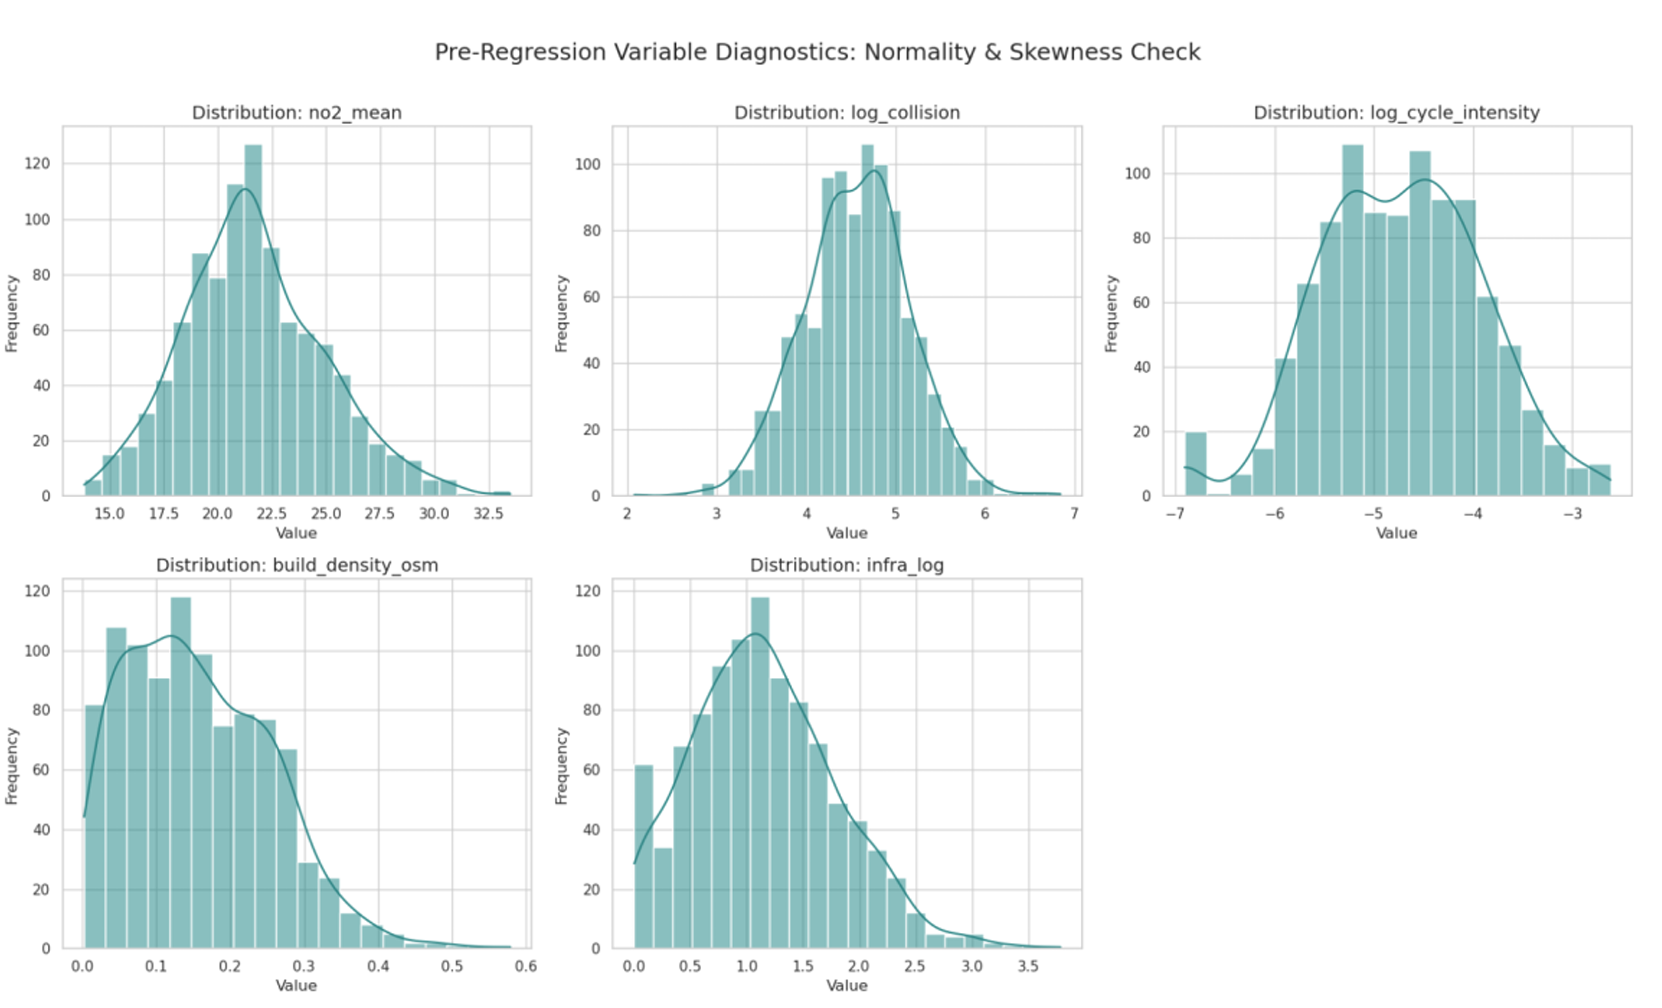
All 983 MSOAs in London are included. Missing values in traffic or infrastructure data are set to zero to ensure full sample consistency. NO₂ and building density are kept on linear scales due to their near-normal distributions. Cycling intensity, collisions, and infrastructure are log-transformed to address skewness.
Unpacking the Lock-in: From Spatial Coincidence to Structural Trap
| Variable/Metric | Stage 1: Cycling–NO₂ Correlation | Stage 2: Traffic Volume Control | Stage 3: Urban Structural Lock | Stage 4: Policy Impact Test |
|---|---|---|---|---|
| Intercept | 34.1045*** | 24.7703*** | 20.6095*** | 20.5246*** |
| log_cycle_intensity | 2.6272*** | 2.1990*** | 1.3318*** | 1.3513*** |
| log_collision | — | 1.6014*** | 1.1049*** | 1.1869*** |
| build_density_osm | — | — | 14.8784*** | 14.5306*** |
| log_collision:infra_log | — | — | — | −0.0266 (ns) |
| Adj. R² | 0.438 | 0.512 | 0.643 | 0.643 |
Note on adjusted R²: Adjusted R² is reported throughout — rather than R² — to account for the differing number of predictors across stages and avoid overstating model fit improvement as variables are added. The infrastructure interaction term in Stage 4 is not statistically significant, and adjusted R² does not improve, providing robust evidence that infrastructure expansion alone is unlikely to reduce pollution exposure under existing urban conditions.
Stage 1 establishes the baseline: cycling intensity is positively associated with NO₂ concentration (adj. R² = 0.438), confirming that high-cycling areas tend to coincide with heavily polluted traffic corridors. Low-carbon travel does not necessarily entail lower environmental risk.
Stage 2 introduces traffic collision counts as a proxy for motor traffic intensity, raising adj. R² to 0.512. Motor traffic is a key driver of the lock-in: corridors serving major employment centres attract both high cycling demand and substantial traffic volumes.
Stage 3 identifies the underlying physical constraint. Building density substantially improves model fit (adj. R² = 0.643) and reveals a strong positive effect, consistent with street-canyon dynamics that restrict air circulation and trap traffic-related pollution. Urban form plays a more important role than short-term traffic variation in sustaining high exposure.
Stage 4 tests whether the lock-in can be mitigated by cycling infrastructure. The interaction term between infrastructure supply and traffic pressure is not statistically significant, and model fit does not improve. Under existing urban conditions, infrastructure expansion alone is unlikely to reduce pollution exposure. Without broader changes to urban form or substantial reductions in traffic emissions, the spatial lock-in faced by cyclists is likely to persist.
Post-Estimation Diagnostics and Model Validation
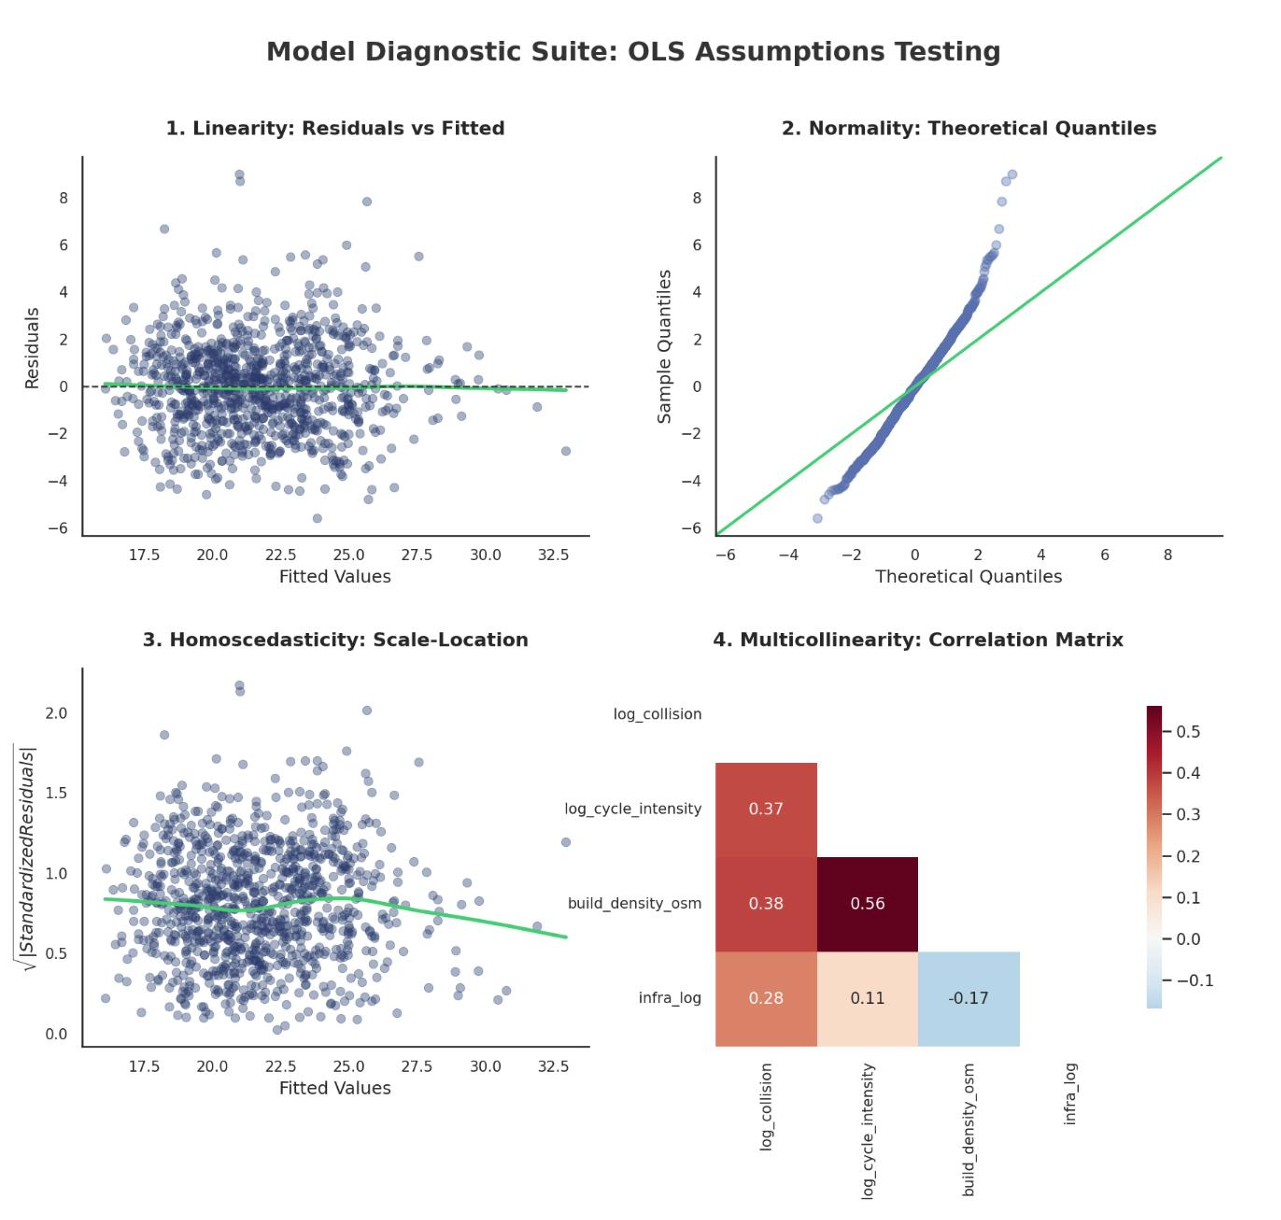
The Stage 4 model was evaluated using standard diagnostic checks. The Residuals vs. Fitted plot indicates that the linear functional form is appropriate. The log-transformations applied to cycling intensity and traffic pressure effectively reduce earlier non-linear patterns, allowing the model to capture the exposure trap without systematic bias across urban contexts.
Residual normality and variance stability were assessed using Q–Q and Scale–Location plots. While mild deviations appear at the distribution tails — a common feature of large urban datasets — residuals largely conform to theoretical expectations. HC3 robust standard errors were employed to further guard against heteroscedasticity across all 983 MSOAs, strengthening confidence that the non-significance of the infrastructure interaction term reflects a genuine empirical result rather than unequal residual variance.
Multicollinearity was examined using Variance Inflation Factors and a correlation matrix. All predictors exhibit low VIF values (below 1.8), indicating limited redundancy among variables. The absence of a significant moderating effect of cycling infrastructure in Stage 4 is therefore unlikely to be driven by multicollinearity, and instead points to a substantive and policy-relevant finding.
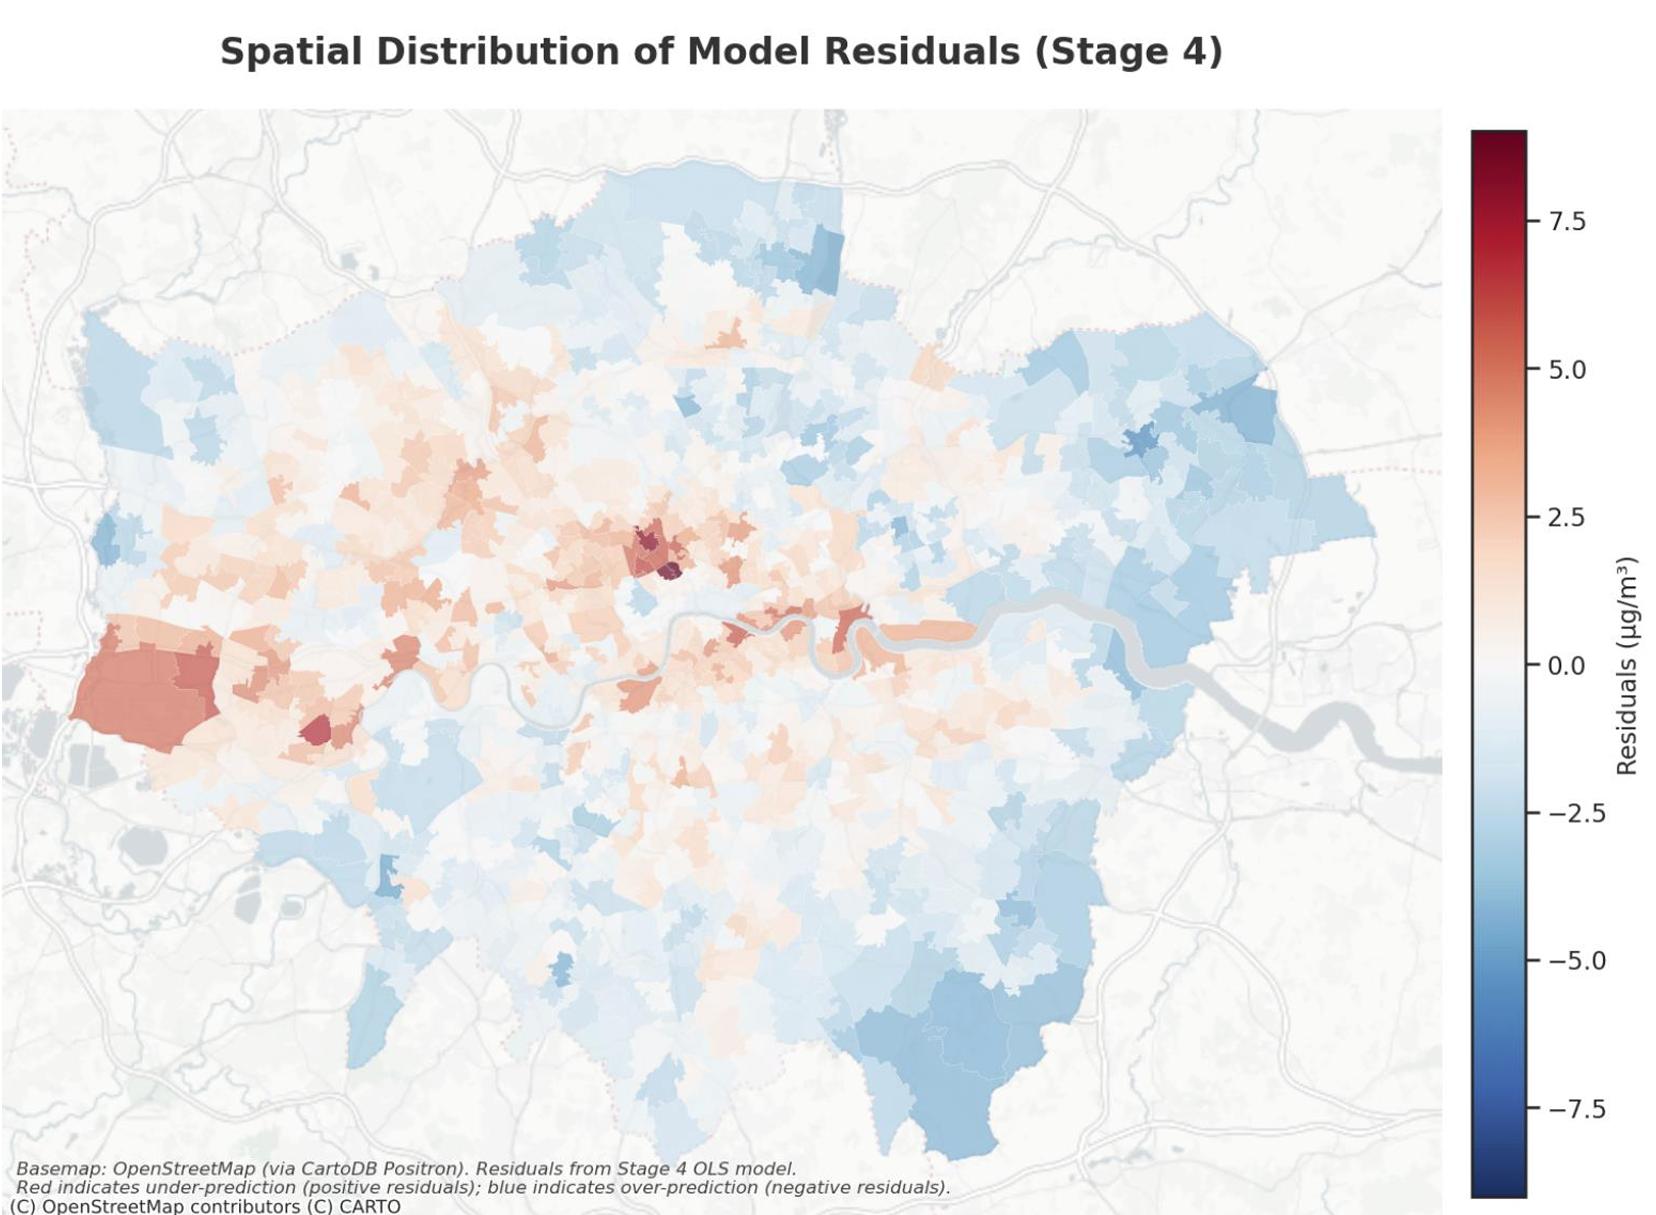
The spatial clustering of residuals suggests the presence of unobserved factors that vary systematically across London rather than random model error. In outer areas, NO₂ concentrations are often lower than predicted by traffic volume and built density alone — likely reflecting better ventilation, more open street layouts, and differences in traffic composition. These conditions are not randomly distributed across MSOAs but tend to be shared across neighbouring areas, producing coherent clusters of over- and under-prediction. This remaining spatial dependence could be examined using a spatial error model; however, as the focus here is on identifying and interpreting the main structural drivers of exposure, introducing additional complexity would reduce the transparency and interpretability of the results. The observed clustering is therefore treated as a substantive feature of the urban environment.
Limitations
The analysis is conducted at the MSOA level, which is well suited to identifying city-wide structural patterns but inevitably involves aggregation effects associated with the Modifiable Areal Unit Problem (MAUP). Neighbourhood-level averages capture background NO₂ exposure but may obscure sharp street-level variation and short-term peaks experienced by cyclists near major roads.
Second, cycling infrastructure is represented using an aggregated measure that does not distinguish between design types or levels of physical separation. Fully segregated lanes are likely to provide different micro-environmental conditions from painted lanes on heavily trafficked roads, and treating them together may mask meaningful variation in environmental performance — potentially helping to explain the absence of a significant moderating effect in Stage 4.
Finally, the NO₂ data reflect conditions prior to the 2023 expansion of London’s Ultra Low Emission Zone (ULEZ). As vehicle electrification and emission standards continue to advance, the relationship between traffic volume and tailpipe emissions is likely to evolve. Future analyses using more recent emissions inventories would be needed to assess whether these policy changes are beginning to weaken the structural exposure patterns identified here.
References
Committee on the Medical Effects of Air Pollutants (COMEAP) (2018). Nitrogen dioxide: effects on mortality. London: Public Health England.
Department for Environment, Food & Rural Affairs (Defra) (2024). Air quality statistics in the UK, 1987 to 2023. London: Defra. Available at: https://www.gov.uk/government/statistics/air-quality-statistics [Accessed: 12 January 2026].
Greater London Authority (GLA) (2022). London Atmospheric Emissions Inventory (LAEI) 2022. London: GLA.
Imperial College London (2021). London health burden of current air pollution and future health benefits of mayoral air quality policies. London: Environmental Research Group, Imperial College London.
Office for National Statistics (ONS) (2021). Census 2021: Method used to travel to workplace (MSOA level). Newport: ONS. Available via Nomis.
OpenStreetMap contributors (2025). Building footprint data for Greater London. Available at: https://download.geofabrik.de/europe/great-britain/england/greater-london.html [Accessed: 12 January 2026].
Talbot, L., Mohan, M.R.J. and Woodcock, J. (2020). ‘Impacts of cycling infrastructure on air quality and health: A London-based study’, Journal of Transport & Health, 18, p.100885.
Transport for London (TfL) (2024). Cycling Infrastructure Database (CID). London: TfL Open Data. Available at: https://cycling.data.tfl.gov.uk [Accessed: 12 January 2026].
World Health Organization (WHO) (2021). WHO global air quality guidelines: particulate matter (PM₂.₅ and PM₁₀), ozone, nitrogen dioxide, sulfur dioxide and carbon monoxide. Geneva: WHO. Available at: https://www.who.int/publications/i/item/9789240034228 [Accessed: 12 January 2026].