
Lost in the Streets: Comparing Community Detection Algorithms Across Three Cities
Published:
If you have ever walked through the City of London, navigated the perfectly tiled blocks of Barcelona’s Eixample, or gotten hopelessly lost in the narrow alleys of Venice, you already have an intuition that these cities feel fundamentally different. But what happens when you ask a computer algorithm to read them?
Community detection — the task of finding groups of densely connected nodes in a network — has become a popular tool in urban analysis. Applied to street networks, it promises to reveal something about how cities are naturally structured: which streets belong together, where one neighbourhood ends and another begins, and how urban form shapes movement and flow.
But here is the catch: there is no single definition of what a “community” is. Different algorithms ask fundamentally different questions of the same network. Run three algorithms on the same city and you will get three different answers. Run one algorithm on three different cities and the results will shift again.
This post does both. Using OSMnx to extract street networks from three cities — the City of London, the Eixample district of Barcelona, and the San Polo sestiere of Venice — and cdlib to run three community detection algorithms, I ask: does the algorithm see the city, or does the city shape the algorithm?
Three Cities, Three Urban Archetypes
The three cities were chosen deliberately to represent three fundamentally different types of urban morphology.
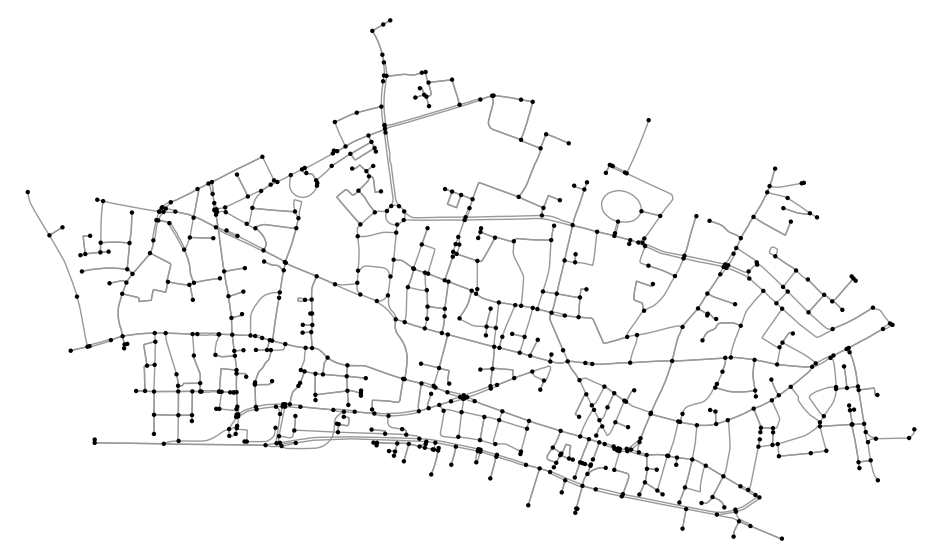
The City of London is the result of organic, unplanned growth. Its street network reflects nearly two thousand years of incremental development — Roman foundations, medieval expansion, post-fire rebuilding, and Victorian additions layered on top of each other. The result is an irregular, asymmetric network with high variability in block size, street width, and connectivity. It has no dominant geometry.
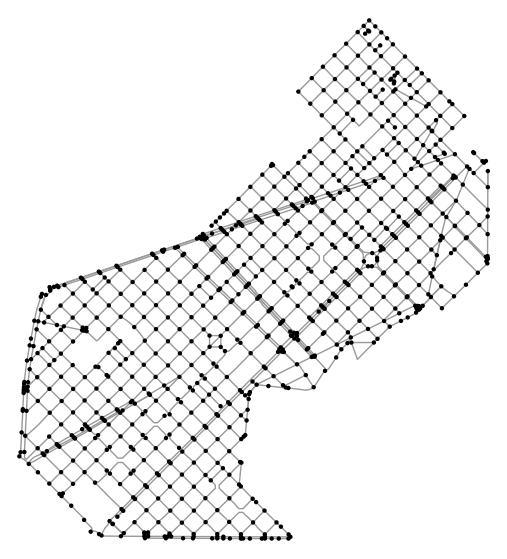
Eixample, Barcelona is the opposite extreme. Designed by Ildefons Cerdà in 1860, it is one of the most celebrated examples of rational urban planning in history. Its defining feature is a near-perfect grid of octagonal blocks, with chamfered corners at every intersection. Every block is roughly the same size. Every intersection looks roughly the same. It is a network of radical, deliberate uniformity.
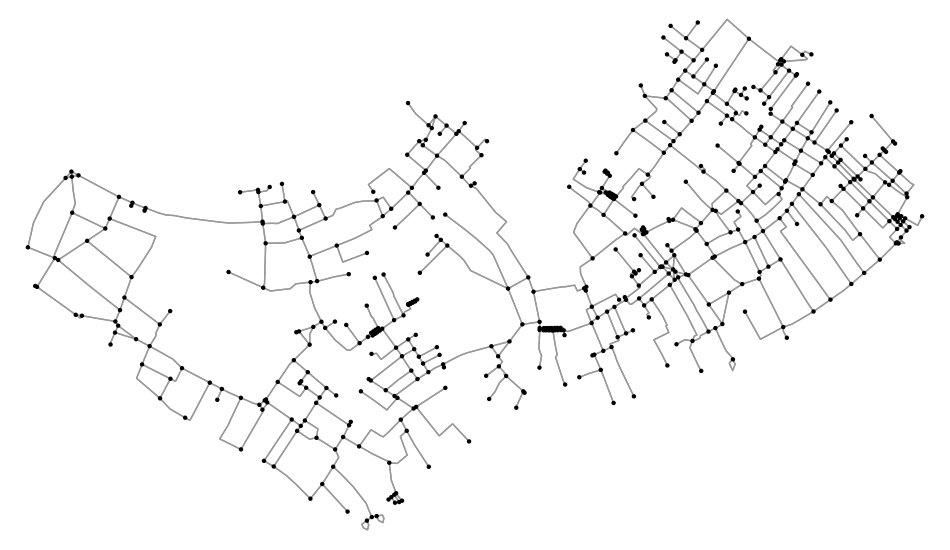
San Polo, Venice is constrained by something neither of the other two cities had to contend with: water. The street network of Venice’s historic centre is shaped entirely by the lagoon’s geography — canals replace roads, bridges create bottlenecks, and the result is a labyrinthine network of narrow pedestrian alleys (calli) punctuated by small squares (campi). It is fragmented by nature, not by plan.
These three cities were not chosen arbitrarily. They represent the three fundamental forces that shape urban street networks: organic growth, rational planning, and geographic constraint. If community detection algorithms are sensitive to urban morphology — and we should expect them to be — these three cities should produce meaningfully different results.
Three Algorithms, Three Ways of Seeing
Just as important as the choice of cities is the choice of algorithms. Community detection is not a single method but a family of approaches, each built on a different theoretical foundation and a different implicit definition of what makes a good community.
For this experiment, three algorithms were selected to cover three distinct paradigms.
Walktrap (Pons & Latapy, 2005) is built on the intuition of random walks. The core idea is simple: a random walker exploring a network will tend to get trapped within densely connected subgraphs, visiting the same nodes repeatedly before finding a bridge to another part of the network. Communities are identified by running many short random walks and clustering nodes that are frequently visited together. For street networks, this has a natural urban interpretation — it approximates the experience of someone wandering through a neighbourhood, more likely to loop around familiar streets than to cross into an entirely different area.
Leiden (Traag, Waltman & van Eck, 2019) takes a different approach, optimising a quantity called modularity — a measure of how much denser the connections within communities are compared to what you would expect from a random network with the same degree distribution. Leiden is an improvement over the earlier and widely-used Louvain algorithm, adding a critical refinement step that guarantees every detected community is internally connected. This matters for spatial networks: Louvain can produce communities that are topologically disconnected, which makes no sense in a geographic context. Leiden fixes this.
Infomap (Rosvall & Bergstrom, 2008) comes from information theory. Rather than maximising modularity, it minimises the description length of a random walk through the network — essentially asking: what partition of the network allows us to describe the path of a random walker most efficiently? Communities are places where information flow tends to circulate before escaping. Crucially, Infomap natively supports directed and weighted networks, making it the only algorithm in this set that can properly account for the directionality of one-way streets.
Together, these three algorithms ask three different questions of the same street network:
- Walktrap asks: where does a random walker get stuck?
- Leiden asks: where are connections denser than chance would predict?
- Infomap asks: where does information tend to circulate?
These are not equivalent questions, and we should not expect equivalent answers.
A note on implementation: all three algorithms were run on undirected versions of the OSMnx street graphs, with edge weights set to the inverse of street length (so that shorter streets — implying stronger local connectivity — carry higher weight). Modularity, coverage, and performance were computed for each partition to enable cross-algorithm and cross-city comparison.
Not all community detection algorithms are created equal — and not all of them are suitable for street networks. Here is a quick reference of the main algorithms I considered before settling on the three used in this experiment.
| Algorithm | Type | Core Principle | Directed | Weighted | Complexity | Best Used When |
|---|---|---|---|---|---|---|
| Girvan-Newman | Divisive hierarchical | Iteratively removes edges with highest betweenness | ✓ (iGraph only) | ✓ (iGraph only) | O(N³) | Small networks, need precise community boundaries, research settings |
| Clauset-Newman-Moore | Agglomerative hierarchical | Greedy merging to maximise modularity | ✗ | ✓ | O(N log²N) | Large undirected networks, fast exploratory analysis |
| Walktrap | Agglomerative hierarchical | Short random walks tend to stay within the same community | ✗ (directed → undirected) | ✓ | O(N²log N) | Street networks, uneven density networks |
| Leading Eigenvector | Spectral | Computes eigenvector of modularity matrix for largest positive eigenvalue | ✗ | ✗ | Moderate | Undirected unweighted networks, theoretically rigorous settings |
| Louvain | Modularity optimisation | Local modularity optimisation then super-node aggregation, iterative | ✗ | ✓ | O(N) | Large-scale networks, need fast results |
| Leiden | Modularity optimisation | Louvain + refinement phase guaranteeing internal connectivity | ✗ | ✓ | O(N log N) | Need guaranteed connected communities, better alternative to Louvain |
| Infomap | Information theory | Minimises description length of random walker trajectory | ✓ | ✓ | O(N) | Directed networks, flow data, need highest node classification accuracy |
Results
Metrics Summary
| City | Algorithm | N Communities | Modularity | Coverage | Performance |
|---|---|---|---|---|---|
| City of London | Walktrap | 38 | 0.8978 | 0.9141 | 0.9536 |
| City of London | Leiden | 23 | 0.8896 | 0.9277 | 0.9571 |
| City of London | Infomap | 80 | 0.8512 | 0.8275 | 0.9890 |
| Eixample, Barcelona | Walktrap | 30 | 0.8368 | 0.8644 | 0.9487 |
| Eixample, Barcelona | Leiden | 16 | 0.8507 | 0.9035 | 0.9386 |
| Eixample, Barcelona | Infomap | 70 | 0.7803 | 0.7726 | 0.9866 |
| San Polo, Venice | Walktrap | 35 | 0.8824 | 0.9296 | 0.9552 |
| San Polo, Venice | Leiden | 21 | 0.8719 | 0.9411 | 0.9530 |
| San Polo, Venice | Infomap | 66 | 0.8269 | 0.8477 | 0.9866 |
Modularity measures how much denser the connections within communities are compared to a random network. Scores above 0.7 are generally considered strong. It has a known limitation — the resolution limit — where optimisation tends to merge small but genuine communities into larger ones, which is one reason Leiden consistently produces fewer, larger communities than Walktrap.
Coverage measures the proportion of edges that fall within communities rather than between them. A high coverage score means the partition is capturing most of the network’s real internal connections, rather than cutting across them.
Performance measures the fraction of all possible node pairs that are correctly classified — nodes in the same community that are actually connected, and nodes in different communities that are genuinely not. Infomap consistently achieves ~0.99 across all three cities, which sounds impressive until you realise it does so by producing hundreds of tiny, statistically clean but geographically meaningless communities.
The tension between these three metrics is itself one of the key findings of this experiment: a partition can score well on Performance while scoring poorly on Modularity. There is no single number that captures whether a community partition is good — it depends entirely on what you are trying to do with it.
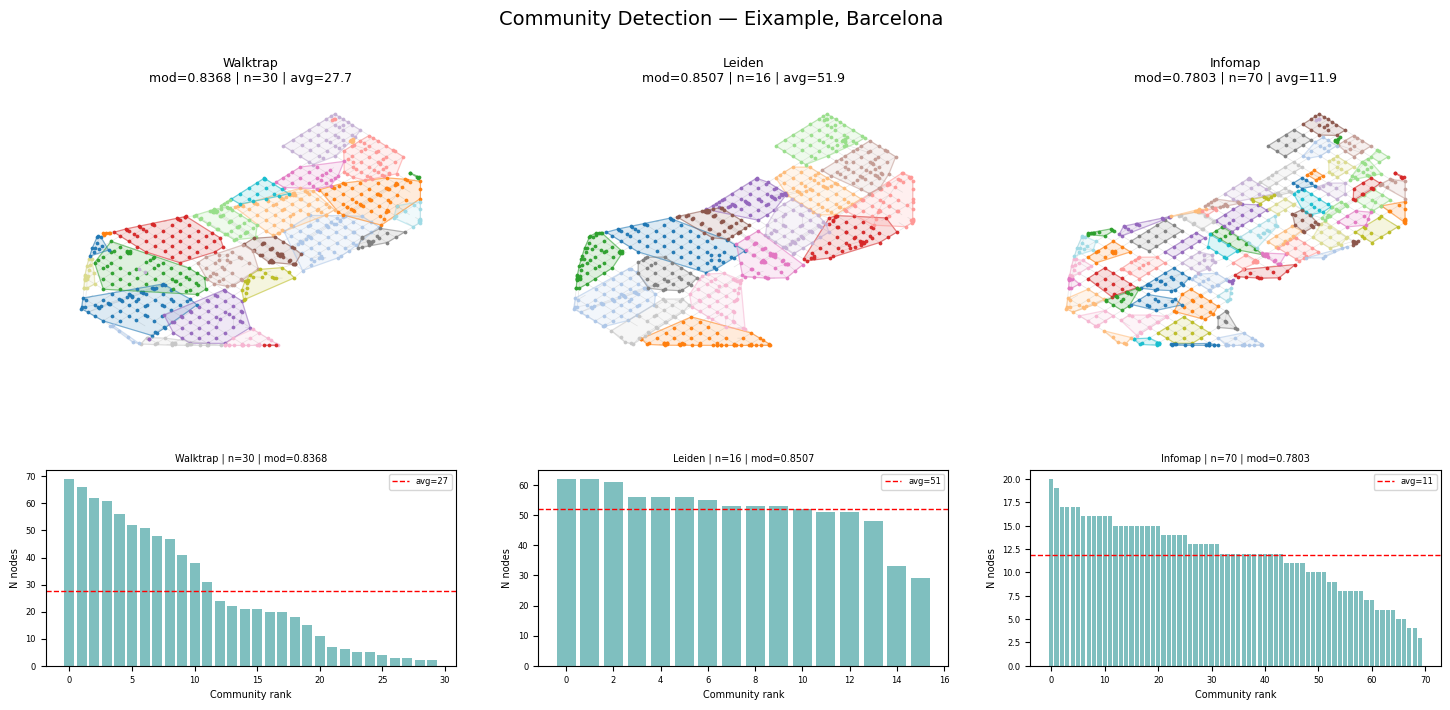
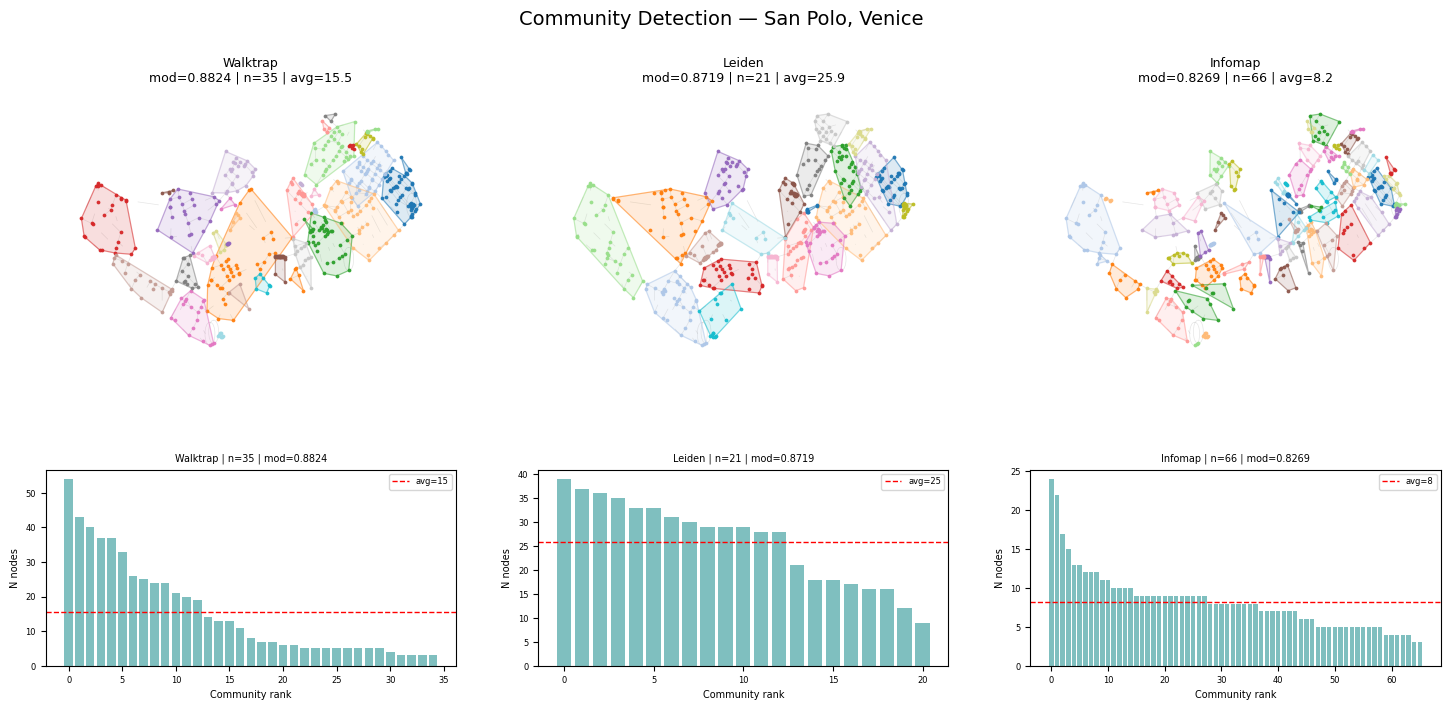
Finding 1: The algorithm ranking is stable, but the city changes everything
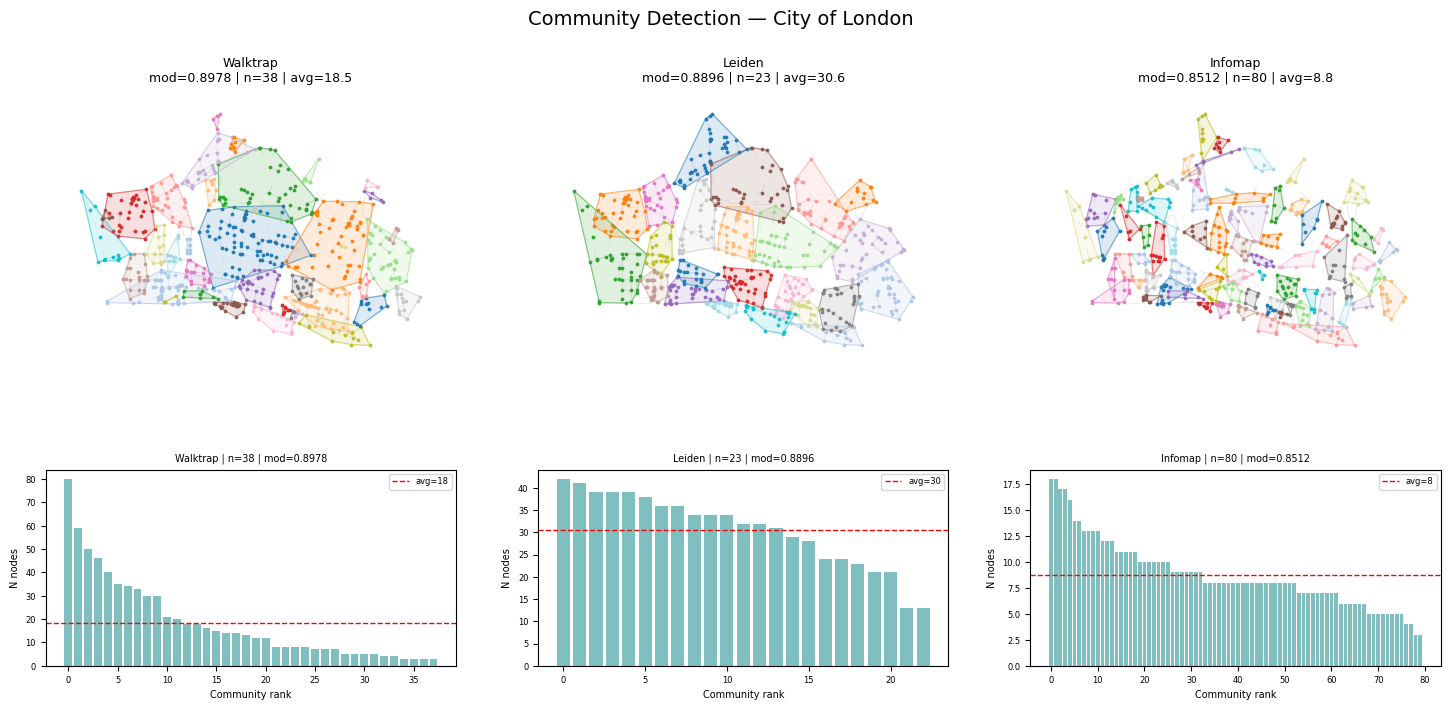
The most striking result is how consistent the relative ranking of algorithms is across all three cities. In every case, Walktrap produces the highest modularity, Leiden produces the fewest and largest communities, and Infomap over-partitions while achieving near-perfect Performance (~0.99). The hierarchy does not change regardless of whether you are looking at medieval London, rational Barcelona, or labyrinthine Venice.
What does change is the absolute values and the community sizes. Eixample consistently produces the lowest modularity scores across all three algorithms — with Infomap dropping as low as 0.7803 — and the largest average community sizes under Leiden (avg=51.9 nodes per community, compared to 30.6 in London and 25.9 in Venice). The grid’s radical uniformity leaves the algorithm with very little structural signal to work with. When every intersection looks the same, there is less modularity to find.
San Polo produces the smallest communities overall, with Walktrap averaging just 15.5 nodes per community. This is consistent with what you would expect from Venice’s topology: the narrow alleys and frequent dead-ends create natural bottlenecks that the algorithms interpret as community boundaries, fragmenting the network into small, tight clusters.
Finding 2: High performance does not mean urban interpretability
Infomap achieves the highest Performance score in every city and every comparison. On paper, this makes it the best algorithm. In practice, it is the least useful for urban analysis.
Performance measures how accurately node pairs are classified — whether two nodes in the same community are actually well-connected, and whether two nodes in different communities are genuinely separated. Infomap’s micro-communities score well on this metric precisely because they are so small: a community of 8 nodes is almost guaranteed to be internally dense. But a community of 8 nodes in a medieval city or a Venetian campo does not correspond to any recognisable urban unit. It is statistically rigorous and geographically meaningless.
This is a broader lesson that applies beyond this experiment. Optimising for a metric is not the same as finding something real. The choice of algorithm should follow the research question, not the other way around.
Finding 3: Urban morphology is legible in the community structure
Perhaps the most visually compelling result is how different the community maps look for each city, even under the same algorithm.
In the City of London, communities under Leiden are large, irregular polygons that roughly correspond to recognisable clusters of streets — the kind of organic groupings you might expect from a city that grew without a plan. The convex hulls are uneven and overlapping, reflecting the network’s complexity.
In Eixample, the communities are more regular in shape, reflecting the underlying grid. Leiden in particular produces very large communities that span multiple blocks, suggesting that the algorithm cannot find strong internal boundaries in a network designed to have none. The uniformity of the grid is the point — and it makes community detection harder.
In San Polo, the communities are small and scattered, disconnected from each other in ways that mirror the physical fragmentation of the island’s topology. The bridges and bottlenecks that define movement in Venice show up clearly as community boundaries.
Conclusion
Running community detection on street networks is easy. Interpreting the results requires understanding both the algorithm and the city.
This experiment shows that the relative behaviour of algorithms is robust — Walktrap will always find more granular communities than Leiden, and Infomap will always over-partition — but the absolute results are shaped by urban morphology in ways that are both measurable and visually interpretable. A grid city like Eixample is harder to partition than an organic city like the City of London. A constrained network like Venice produces smaller, more fragmented communities than either.
The deeper lesson is about the relationship between method and meaning. No algorithm is universally better. Walktrap’s random walk intuition maps naturally onto pedestrian movement. Leiden’s connectivity guarantees make it appropriate for spatial analysis. Infomap’s direction-awareness makes it the right tool when one-way streets matter. The question is not which algorithm wins, but which question you are trying to answer.
The streets were there long before the algorithms. The algorithms just help us see them differently.
References
- Pons, P. & Latapy, M. (2005). Computing communities in large networks using random walks. Computer and Information Sciences.
- Traag, V.A., Waltman, L. & van Eck, N.J. (2019). From Louvain to Leiden: guaranteeing well-connected communities. Scientific Reports, 9, 5233.
- Rosvall, M. & Bergstrom, C.T. (2008). Maps of random walks on complex networks reveal community structure. PNAS, 105(4), 1118–1123.
- Boeing, G. (2017). OSMnx: New methods for acquiring, constructing, analyzing, and visualizing complex street networks. Computers, Environment and Urban Planning, 65, 126–139.
- Lancichinetti, A. & Fortunato, S. (2009). Community detection algorithms: a comparative analysis. Physical Review E, 80, 016118.